Spreads
Spreads
Spreads
Spreads
Spreads
Successful trading doesn’t happen overnight. You need to learn many concepts and strategies to build a good foundation on which you would base your decisions every trading day.
In technical analysis, the moving average is one of the most crucial indicators you need to know about and learn.

A moving average is a type of calculation used for analysing data points through a series of averages from different subsets that belong to an entire data set.
The moving average of an instrument is calculated to create an updated average price that will help analysts determine any short-term price fluctuations that could affect trading. It is also a useful technical indicator of a trend and its direction, so you’ll know if you should buy, sell, or pass.
There are two basic forms of moving averages: Simple Moving Average (SMA) and Exponential Moving Average (EMA).
SMA is a straightforward process of summing up past data points in a set and dividing the total by the number of periods. Traders use this technical indicator to determine when they should join and leave a market on a trading day. With the SMA method, a trader can identify support and resistance prices, which are crucial in knowing when to buy or sell.

EMA, on the other hand, relies on the most recent price points, so it’s more responsive to current price fluctuations. EMA starts by summing up the security’s closing prices for a given period and dividing that by the number of periods. Then, the multiplier is calculated using the formula:
(Multiplier = [2/ (10+1)] – 0.1818)
After that, EMA is calculated by taking the period from the initial EMA up to the most recent period using the multiplier, the price, and the previous period’s EMA value.
The formula for this is:
Current EMA = [Closing Price – EMA (Previous Time Period)] x Multiplier + EMA (Previous Time Period)

Although using the moving average method may take some time, many traders have been using it for years as it helps them make the right decisions with their trade. For one, this strategy keeps your analysis straightforward on a price chart by cutting down unnecessary data.
If you look at the moving average, you’ll know if the price is moving up or down. This move can help you decide whether to buy, sell, or sit the market out for a while.
Technical analysts also use the moving average to determine support or resistance in the long term. In an uptrend, the moving average can serve as the support where the prices bounce from. In a downtrend, the moving average will act as the resistance where the price hits and drops again.
The most common use of Moving Average is to determine where the trend is moving, whether Downtrend, Uptrend or Reversal.
There are 2 ways to do this:
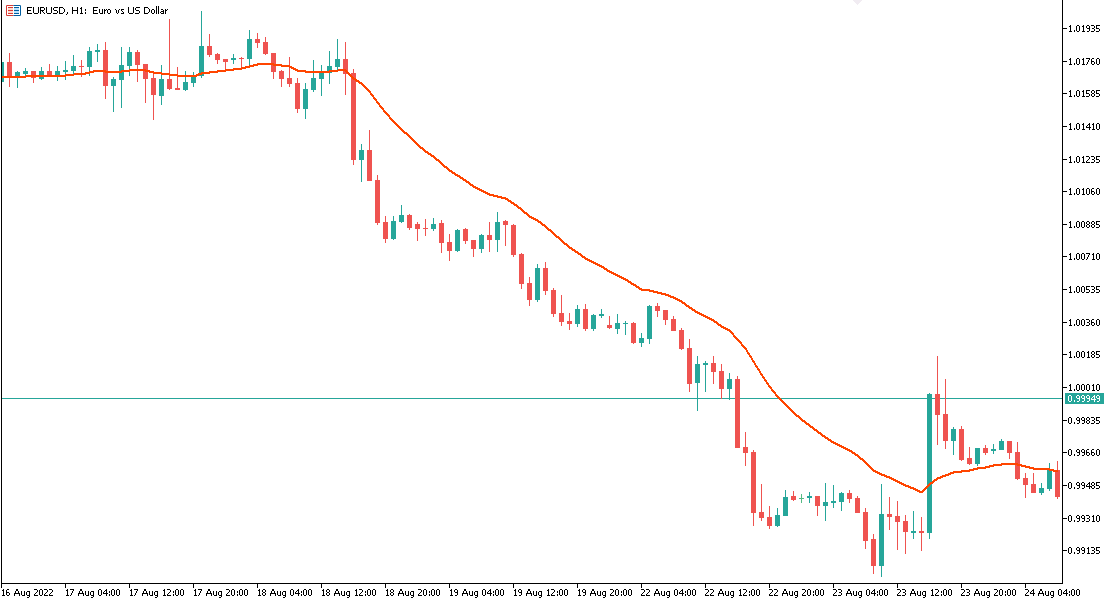
Some traders use only one Moving Average by looking at the candles (price). If the price moves above the Moving Average, sloping higher, they believe the trend is an uptrend.

If the price moves below the moving average, sloping down, they believe the trend is a downtrend.
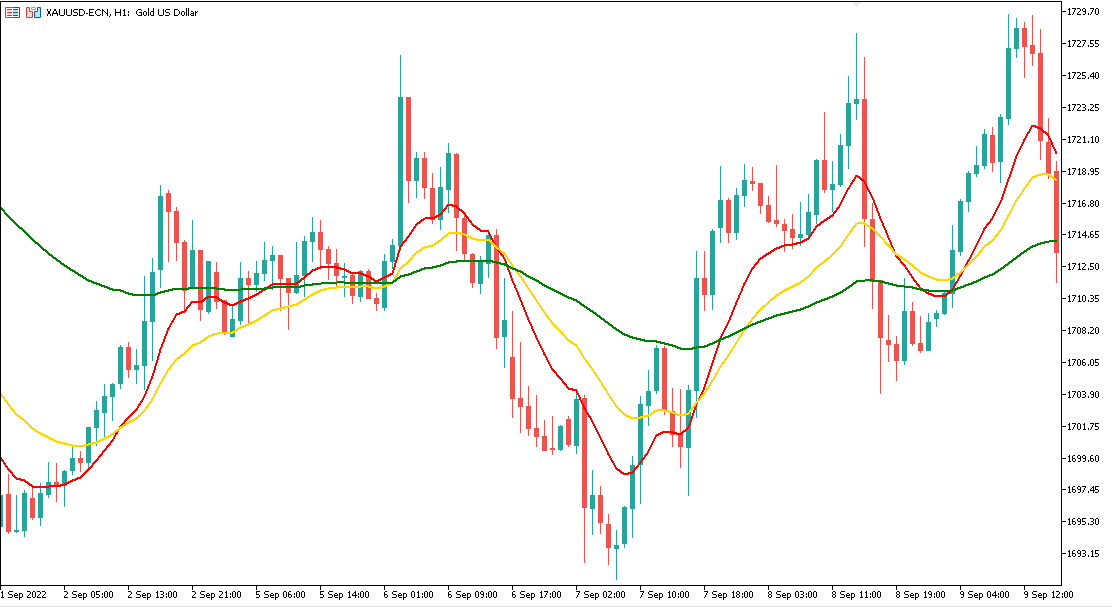
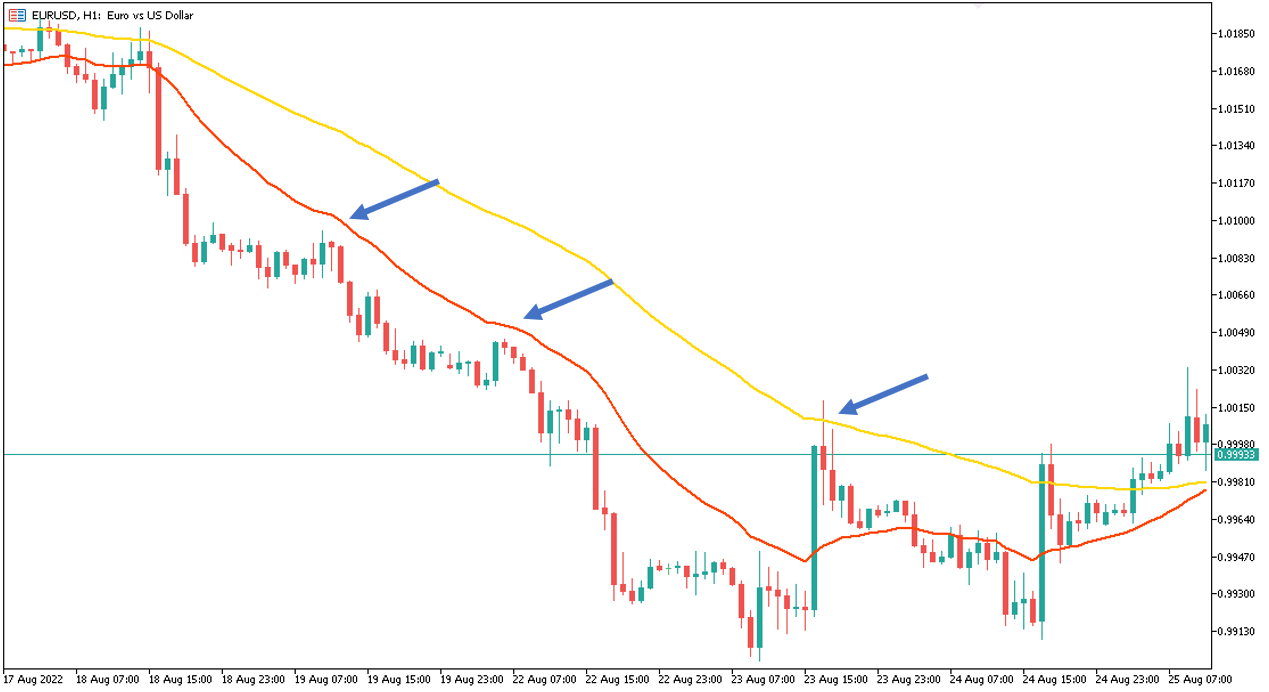
Other traders use 2 Moving Averages (slower- and faster-moving averages) and the candles (price) to know where the market is going and if there is a potential reversal.
If the candle (price) moves above the 2 Moving Averages and the faster-moving average is above the slower-moving average, they believe the trend is an uptrend.

If the candle (price) moves below the 2 Moving Averages and the faster-moving average is below the slower-moving average, they believe the trend is a downtrend.

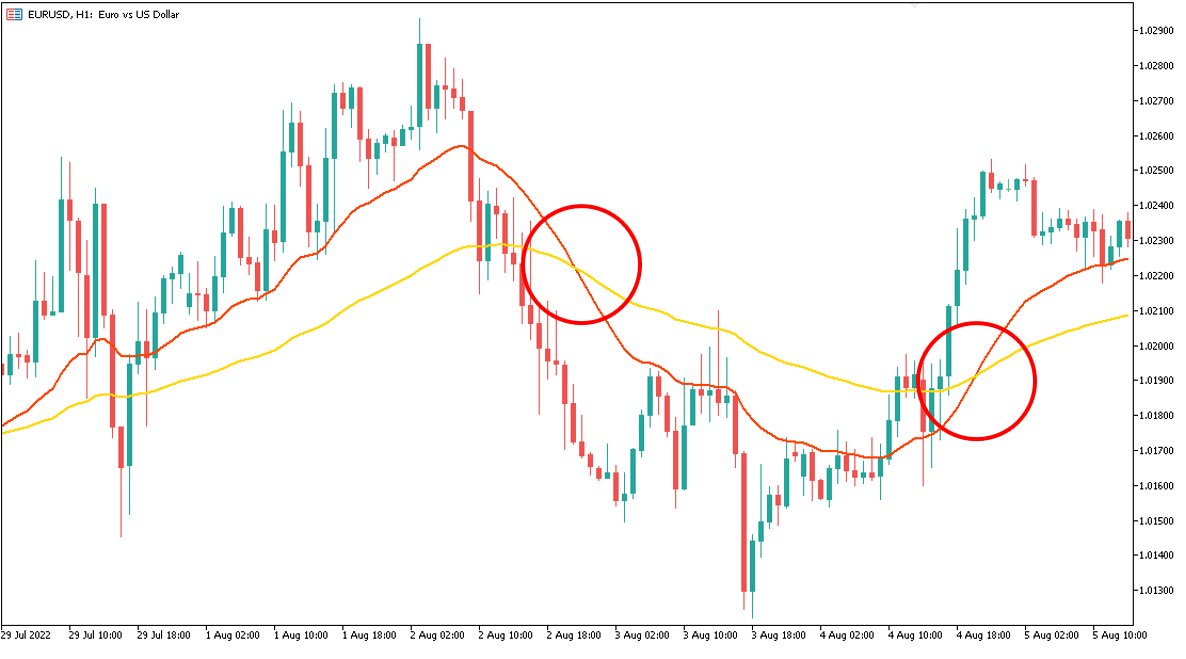
Using 2 Moving Averages allows traders to determine when a trend has a potential reversal. If there’s a cross between the moving averages, there’s a possible reversal, or at least the trend is slower.
Another common use of a Moving Average is to find the support and resistance levels in a moving trend.
Usually, traders use 2 Moving Averages.
If the candle (price) moves above the 2 Moving Averages and the faster-moving average is above the slower-moving average, they believe the trend is still an uptrend. Then we can use the Moving Averages as the Support levels.
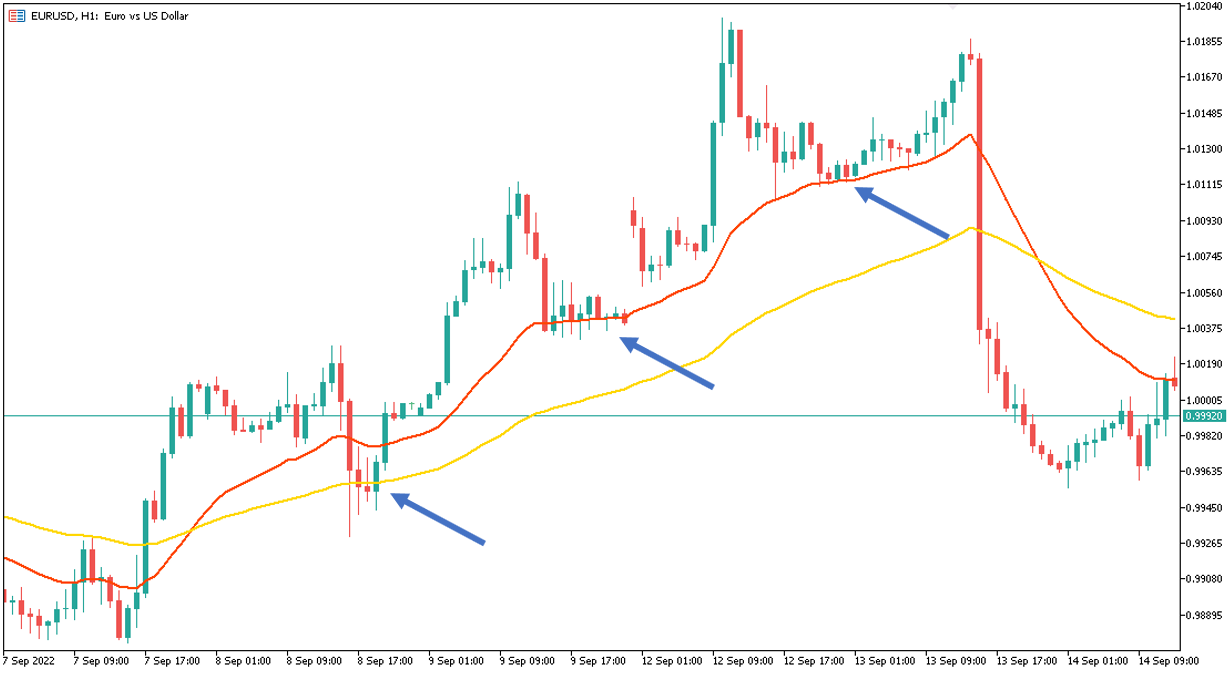
If the candle (price) moves below the 2 Moving Averages and the faster-moving average is below the slower moving average, they believe the trend is a downtrend. Then we can use the Moving Averages as the Resistance levels.
If you want to learn all about moving averages, it’s a must to study this method and ask for advice from traders who have been using it for a while. You can also tap into the expertise of a Forex broker for guidance.
Of course, it would be highly beneficial to join a community for trading updates, market changes, and strategies to help you maximise your trading day and earn the best returns from your investment.