Spreads
Spreads
Spreads
Spreads
Spreads
You probably know by now that the financial market can be volatile and unpredictable. This is why it’s your responsibility as a trader to learn all the tools, strategies, and disciplines that will help you make intelligent decisions when trading.
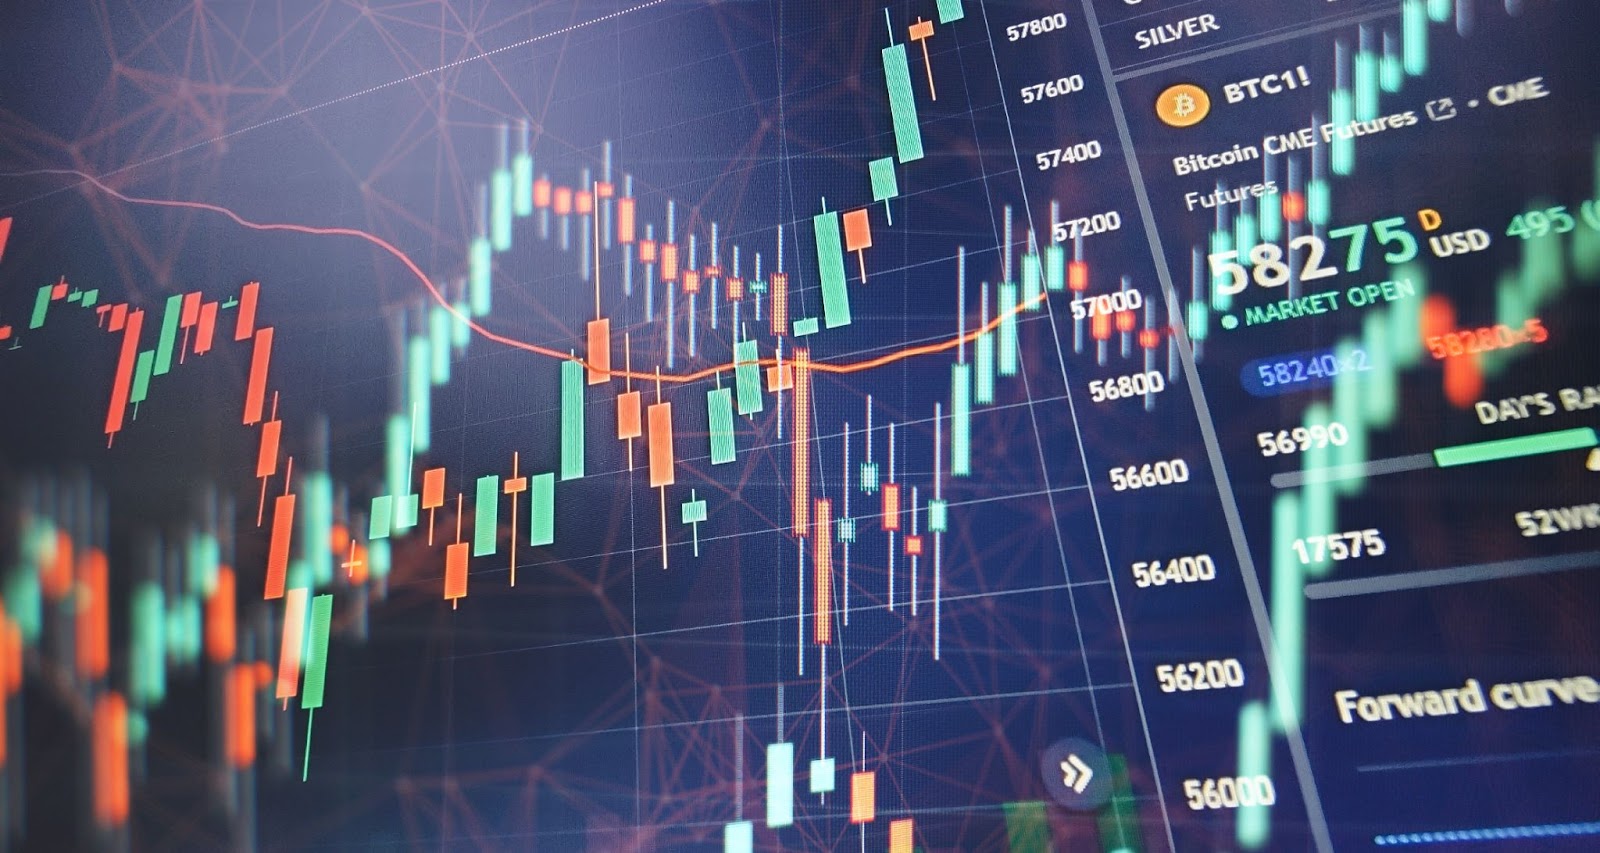
One of the key aspects you need to master is technical analysis.

In essence, technical analysis is a strategy or method where past data, such as indicators and price actions, help a trader make the best decision for future trading.
This theory comes from the belief that the buying and selling actions of traders reflect the information related to a particular instrument.
Multiple technical traders also believe that current or past price movements are the most reliable indicators of future price movements.
Data accuracy is critical to the efficiency of any technical analysis in trading. So, if you want to be successful at using this strategy, here are some common mistakes that you need to avoid:
Mistakes can lead to huge risks that can make or break your trading account. As much as possible, avoid these mistakes when trading to ensure earning potential.
Technical analysis has evolved over the years, with analysts now using different trading systems to help them create forecasts on price movements. Depending on what you want to focus on, a technical analysis indicator can offer information on current market trends, the continuation of these trends, and support and resistance areas.

In general, technical analysts use the most common indicators, including chart patterns, support and resistance levels, price trends, moving averages, and volume and momentum indicators.
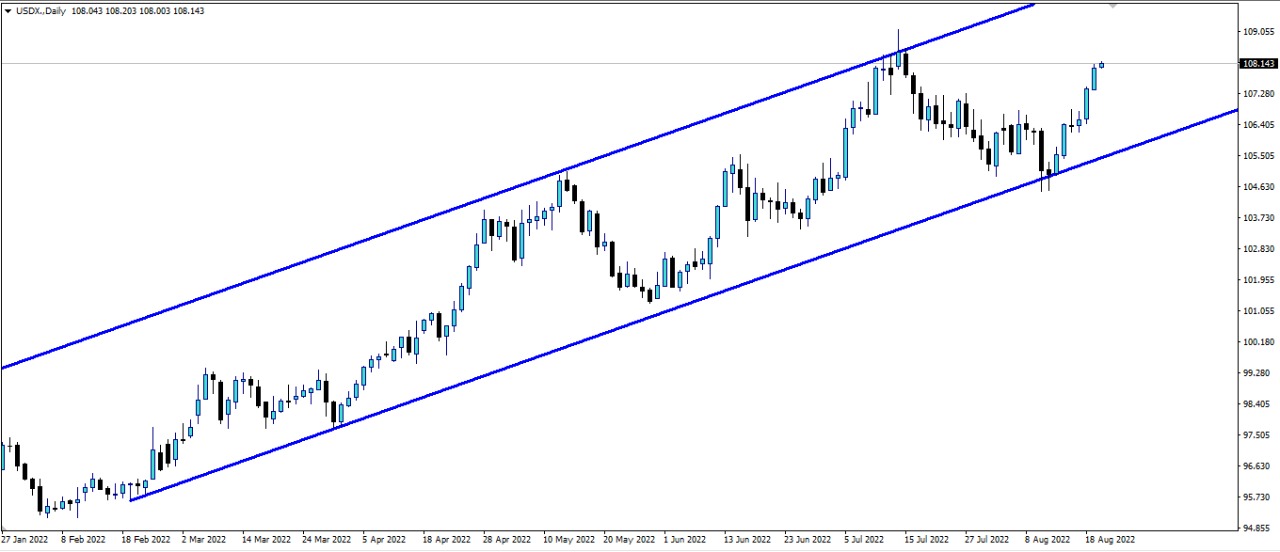
Source: VT Markets MT4
Both technical and fundamental analyses are crucial methods in analysing the markets, although they are at opposing ends of the spectrum.
Fundamental analysis uses methods that attempt to measure the intrinsic value of an instrument. This means analysing data related to industry conditions and the overall economy since they can influence a trade.
On the other hand, technical analysis only uses data from an instrument’s volume and price, following the belief that one can factor all fundamental indicators into pricing. For this reason, there’s no need to look at them. Instead, technical analysis focuses on charts to identify trends and patterns that can influence future trades.
Fundamental analysis takes more time because it looks at more types of data to give a clear picture of the situation of an instrument and its trading potential. Technical analysis offers a faster way to analyse data and make future trading decisions based on them.
As a trader, you must learn how to maximise technical analysis as a tool to build your portfolio, increase your earnings, and create a stable financial future for you and your family. In a competitive world like trading, it is essential to equip yourself with the best trading tools to succeed and protect yourself against losses.
Trade with a regulated multi-asset broker, VT Markets.