Spreads
Spreads
Spreads
Spreads
Spreads

Last week, the US dollar moved higher against some major currencies as markets reacted to a stronger-than-expected Non-Farm Employment report.
(All data taken from MT4 VT Markets)

(Picture taken from forexfactory.com)
Inflation-related data will dominate this week, with the market eyeing the Consumer Price Index and Producer Price Index data from the US and the Gross Domestic Product data from the UK to provide further clues on the durability of inflation pressures.
The Consumer Price Index in the United States increased 1.3% month-on-month in June 2022, the biggest rise since September 2005, resulting in an increase in the annual inflation rate to 9.1% in the same month this year, the highest since November 1981.
Analysts forecasted that CPI data would be slower at 0.3%, holding the inflation rate at 9.1%.
Producer prices for final demand in the US jumped 1.1% month-on-month in June of 2022, the most in three months.
Analysts forecasted that PPI data would be slower at 0.9%, slowing down inflation.
The British economy unexpectedly expanded 0.5% month-on-month in May 2022, recovering from a 0.2% contraction in April. The GDP is now 1.7% above its pre-coronavirus pandemic levels in February 2020.
For June, analysts forecast GDP to decrease by -0.3%.
The University of Michigan Consumer Sentiment rose to 51.5 in July 2022 from a record low of 50 in June.
There’s some mixed forecast by analysts as some mention it will be higher than 51.5, yet some believe it will be lower.

Last week, The USD index (USDX) moved higher against some major currencies as markets reacted to a stronger-than-expected Non-Farm Employment report. Our support levels are strong enough to hold USD Index as the price was rejected after touching it.
In the Weekly Timeframe, we can see that Stochastic Indicators have reversed lower and left overbought levels, showing that there’s a possibility that USD Index will move back lower. Meanwhile, the 20, 50, and 200-candle Moving Averages are getting closer to the weekly price candles. This may indicate that there’s a lower interest from Buyers.
Our Weekly Resistance Levels are at 108.34 and 109.22, with Support Levels at 105.56 and 104.69.
Meanwhile, in the H4 Timeframe, we can see that the Stochastic Indicators showed a positive movement affected by good Non-Farm Employment report on Friday. Price moves back above 20, 50, and 200-candle Moving Averages showing that higher movement might be there for the short term.
Our H4 Resistance levels are at 106.77 and 107.29, with the Support Levels at 105.53 and 105.10.
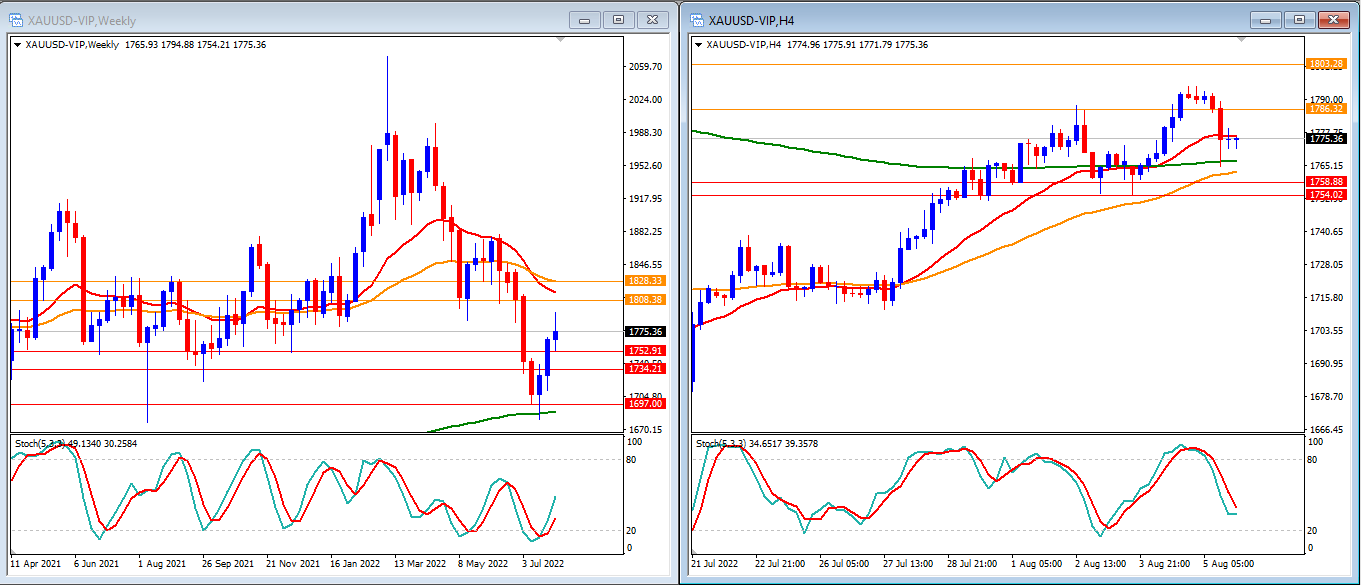
Gold prices gained a little bit last week and got a positive movement for the third week. Potential movement this week is still between our Support and Resistance Levels, which haven’t been broken.
In the Weekly Timeframe, we can see that the Stochastic Indicators are rising from the oversold level showing that Gold might move higher. Gold prices move above the 200-candle Moving Average and below the 20-candle and 50-candle Moving Averages.
Our Weekly Resistance Levels are at $1808 and $1828, with the Support Levels at $1752 and $1734.
Meanwhile, in the H4 Timeframe, we can see that the Stochastic Indicators show a lower movement, indicating that Gold might slightly go lower in the short term. Price is now moving above 50 and 200-candles Moving Average and just below and trying to break above 20-candles Moving Average.
Our H4 Resistance Levels are at $1786 and $1803, with the Support Levels at $1758 and $1754.

Last week, US stocks enjoyed another strong week for markets. This week, we can see that our resistance levels will hold NAS100 and that the Stochastic Indicators are entering the overbought level. With the price just rejected for some weeks by the 200-candle Moving average and moving in above 20-candle Moving Average and reaching the 50-candle Moving Average, we can expect that the higher movement is still limited.
Our Weekly Resistance Levels are at 13349 and 13895, with the Support Levels at 12739 and 12427.
While in our H4 Timeframe, we can see that our Stochastic Indicators show a lower movement from an overbought level, which indicates that there’s a possibility that the price will move lower for the short term, with price movement still above the 20, 50, and 200-candle Moving Averages.
Our H4 Resistance Levels are at 13369, while the Support Levels are at 13085 and 12981.
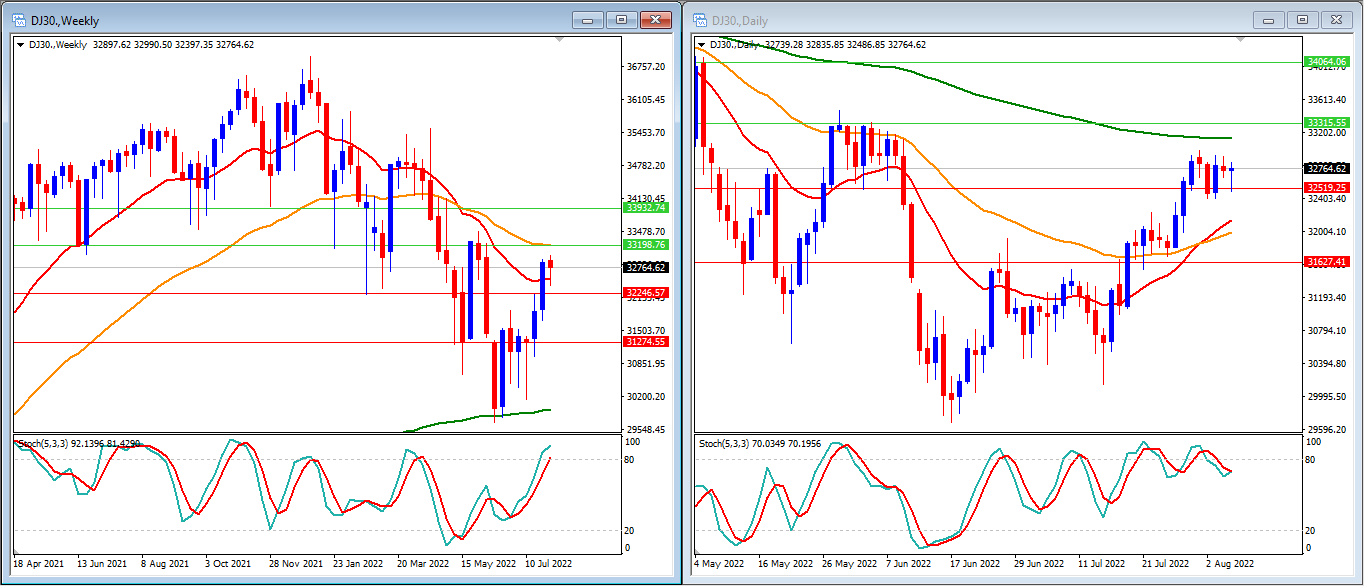
DJ30 didn’t get a good week but still got a consolidative movement at a higher price. This week, we expect higher movement in DJ30, as seen in the Weekly Timeframe. Our stochastic indicators show a higher movement but are already inside the overbought levels. The price moved above 20-candles and is still way above the 200-candle Moving Average. Price is targeting to reach the 50-candle Moving Average.
Our Weekly Resistance Levels are at 33198 and 33932, with the Support Levels at 32246 and 31274.
In our H4 Timeframe, we can see that our Stochastic Indicators are showing a higher movement inside the overbought levels. We can expect DJ30 to go higher with a potential reversal in the short term. The price is trying to reach and break above 200-candle Moving Average and is supported by the 20- and 50-candle Moving Averages. We can see a possible moving higher to Resistance and back lower.
Our H4 Resistance Levels are at 33315 and 34064, while the Support Levels are at 32519 and 31627.