Spreads
Spreads
Spreads
Spreads
Spreads
Make informed decisions with the most up-to-date and reliable financial data, exclusively provided by vtmarkets.com.
EUR/USD Retreats from Three-Week High Amid Mixed US Economic Signals and ECB Caution
EUR/USD experienced a decline from its three-week peak around 1.0900, settling near 1.0820 after an initial surge, influenced by positive US job data and varied bond yield performances amidst speculation of future Federal Reserve (Fed) interest rate cuts. The possibility of the Fed easing monetary policy has been bolstered by strong US inflation figures, though the likelihood of a May rate cut seems diminished, with a greater chance anticipated for June. Conversely, the European Central Bank (ECB) maintains a cautious stance against early rate reductions, despite expectations of a downward inflation forecast revision in March. This cautious approach is echoed by ECB officials, emphasizing the premature nature of financial market relaxation, and highlighting ongoing concerns over wage pressures and the labour market’s tightness, suggesting a potential delay in the ECB’s monetary easing.
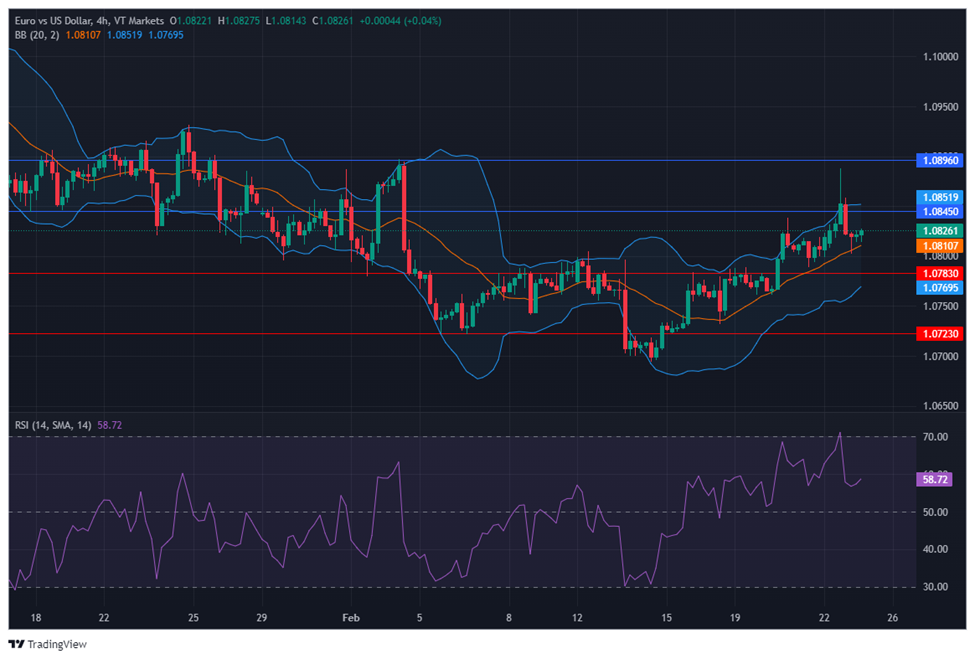
On Thursday, the EUR/USD moved higher and reached the upper band of the Bollinger Bands. Currently, the price is moving just above the middle band, suggesting a potential upward movement to reach back to the upper band. Notably, the Relative Strength Index (RSI) maintains its position at 58, signaling a neutral outlook for this currency pair.
Resistance: 1.0845, 1.0896
Support: 1.0783, 1.0723
XAU/USD Retreats from Peak as US Dollar Recovers Amid Positive Economic Indicators
Spot Gold receded from its recent high of $2,034.86 as the US Dollar regained strength following positive US economic data and increased government bond yields. Despite the Dollar’s initial drop amid a tech-led stock market rally in Asia and Europe, it rebounded before the US markets opened, influenced by less-than-expected growth in Initial Jobless Claims and a surge in February’s PMI figures, indicating a robust expansion in manufacturing and a slight contraction in services. Meanwhile, the 10-year Treasury note yields touched multi-week highs, driven by the Federal Open Market Committee’s minutes, which suggested a cautious approach towards rate cuts, awaiting further inflation progress.
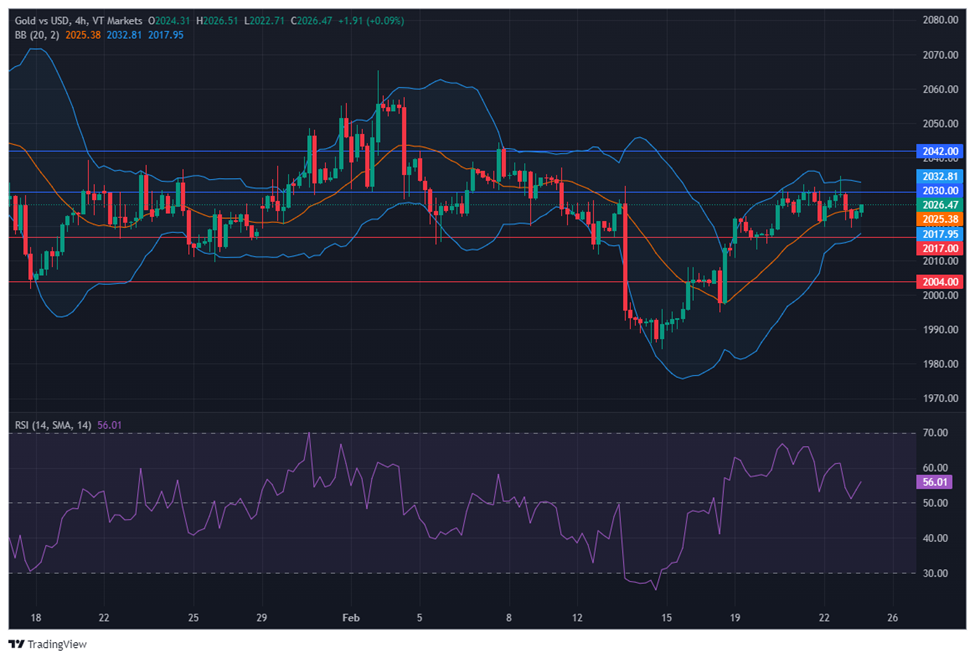
On Thursday, XAU/USD moved lower to reach below the middle band after reaching the upper band of the Bollinger Bands. Currently, the price is moving just around the middle band, suggesting a potential consolidation movement as the bands are squeezing. The Relative Strength Index (RSI) stands at 56, signaling a neutral outlook for this pair.
Resistance: $2,030, $2,042
Support: $2,017, $2,004
Make informed decisions with the most up-to-date and reliable financial data, exclusively provided by vtmarkets.com.