Spreads
Spreads
Spreads
Spreads
Spreads
Make informed decisions with the most up-to-date and reliable financial data, exclusively provided by vtmarkets.com.
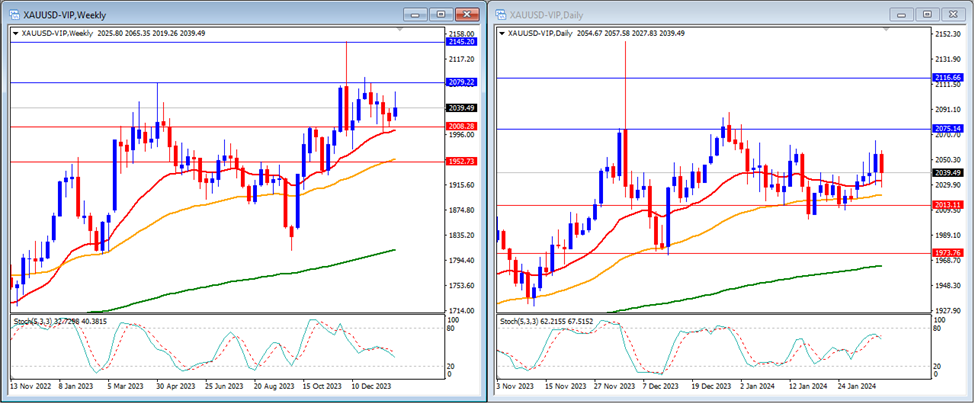
Last week, gold prices rose slightly and closed the week at $2,039.
On the weekly timeframe, the Stochastic Indicator suggests a consolidating movement in the middle. Currently, gold is trading above the 20, 50, and 200-week moving averages.
Weekly resistance levels: $2,079 and $2,145.
Weekly support Levels: $2,008 and $1,952.
On the daily timeframe, the Stochastic Indicator is moving higher, nearing the overbought area. Gold’s price is currently above the 20, 50, and 200-day moving averages.
Daily resistance levels: $2,075 and $2,116.
Daily support levels: $2,013 and $1,973.
Conclusion: This week, we anticipate low volatility due to a lack of high-impact data releases from the US. Our analysts predict a potential upward trend for Gold this week, leading it to possibly reach our resistance level at $2,075.
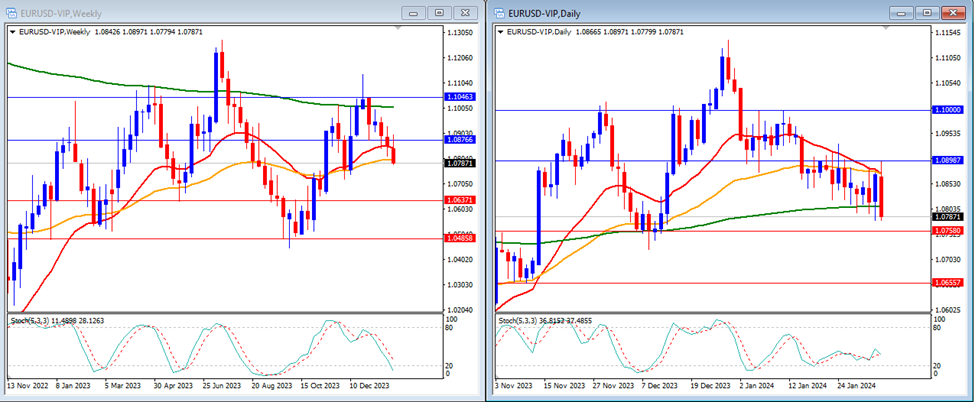
Last week, EUR/USD prices fell and closed the week at 1.0787.
On the weekly timeframe, the Stochastic Indicator is moving lower targeting the oversold area. Currently, the price trades below the 20, 50, and 200-week moving averages.
Weekly resistance levels: 1.0876 and 1.1046.
Weekly support Levels: 1.0637 and 1.0485.
On the daily timeframe, the Stochastic Indicator is moving near the oversold area. Currently, the EUR/USD price stands below the 20, 50, and 200-day moving averages.
Daily resistance levels: 1.0898 and 1.1000.
Daily support levels: 1.0758 and 1.0655.
Conclusion: This week, we anticipate low volatility due to a lack of high-impact data releases from the US. Our analysts predict a potential upward trend for EUR/USD this week, possibly leading it to reach our resistance level at 1.0876.
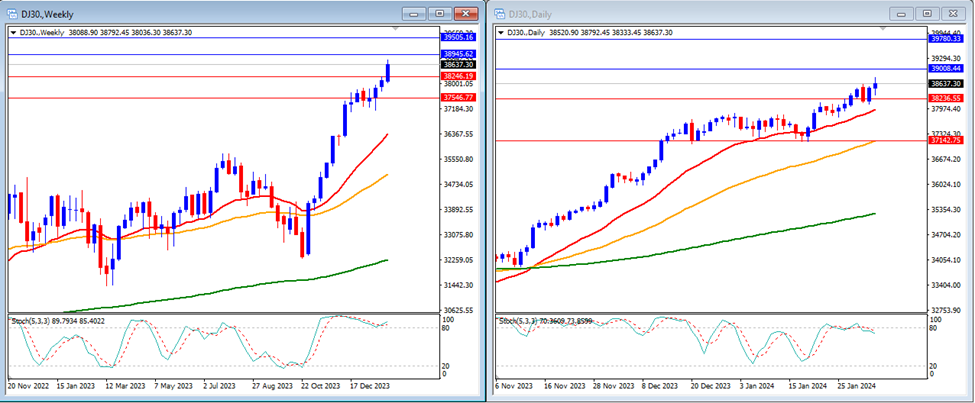
Last week, DJ30 prices rose and closed the week at 38,637.
On the weekly timeframe, the Stochastic Indicator consolidated within the overbought area. Currently, the indices trade above the 20, 50, and 200-week moving averages.
Weekly resistance levels: 38,945 and 39,505.
Weekly support Levels: 38,246 and 37,546.
On the daily timeframe, the Stochastic Indicator is moving just below the overbought area. Currently, the price is above the 20, 50, and 200-day moving averages.
Daily resistance levels: 39,008 and 39,780.
Daily support levels: 38,236 and 37,142.
Conclusion: This week, we anticipate low volatility due to a lack of high-impact data releases from the US. Our analysts predict a potential upward trend for the DJ30, possibly reaching our resistance level at 39,008.
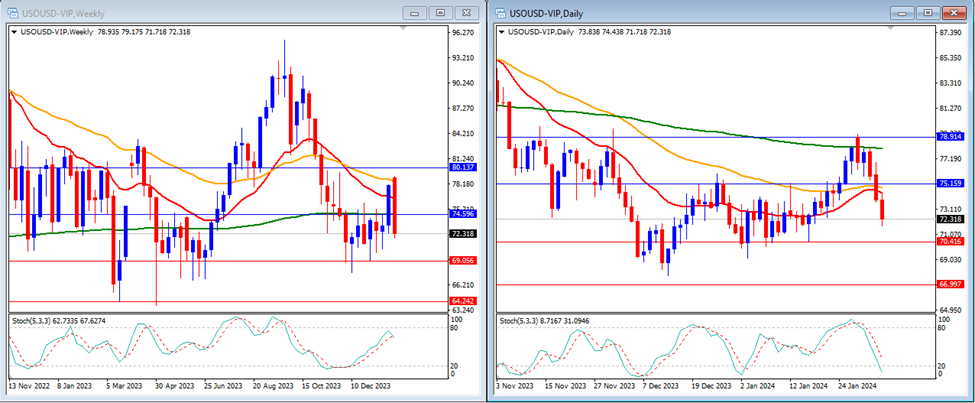
Last week, USO/USD prices fell strongly and closed the week at 72.31.
On the weekly timeframe, the Stochastic Indicator indicates an upward movement targeting the overbought area. The price is now below the 20, 50, and 200-week moving averages.
Weekly resistance levels: 74.59 and 80.13.
Weekly support Levels: 69.05 and 64.24.
On the daily timeframe, the Stochastic Indicator is moving lower, entering the oversold area, and the price is currently below the 20, 50, and 200-day moving averages.
Daily resistance levels: 75.15 and 78.91.
Daily support levels: 70.41 and 66.99.
Conclusion: This week, we anticipate low volatility due to a lack of high-impact data releases from the US. Additionally, we must remain vigilant regarding any updates on tensions in the Middle East. Our analysts foresee potential upward momentum for USO/USD this week, possibly driving it toward our next resistance level at 75.15.
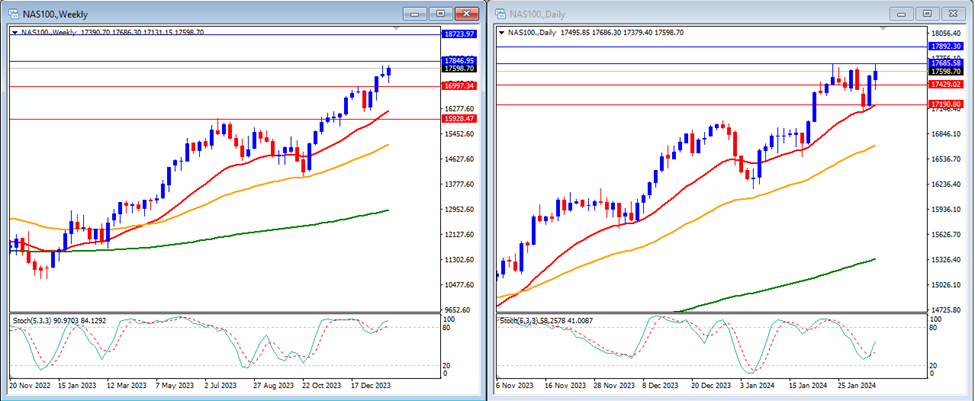
Last week, NAS100 prices rose slightly and closed the week at 17,598.
On the weekly timeframe, the Stochastic Indicator is moving inside the overbought area, while the price continues to trade above the 20, 50, and 200-week moving averages.
Weekly resistance levels: 17,846 and 18,723.
Weekly support Levels: 16,997 and 15,928.
On the daily timeframe, the Stochastic Indicator is crossing back higher just above the oversold area. Currently, the price is above the 20, 50, and 200-day moving averages.
Daily resistance levels: 17,685 and 17,892.
Daily support levels: 17,429 and 17,190.
Conclusion: This week, we anticipate low volatility due to a lack of high-impact data releases from the US. Our analysts predict a potential upward trend for NAS100, possibly reaching our resistance level at 17,846.
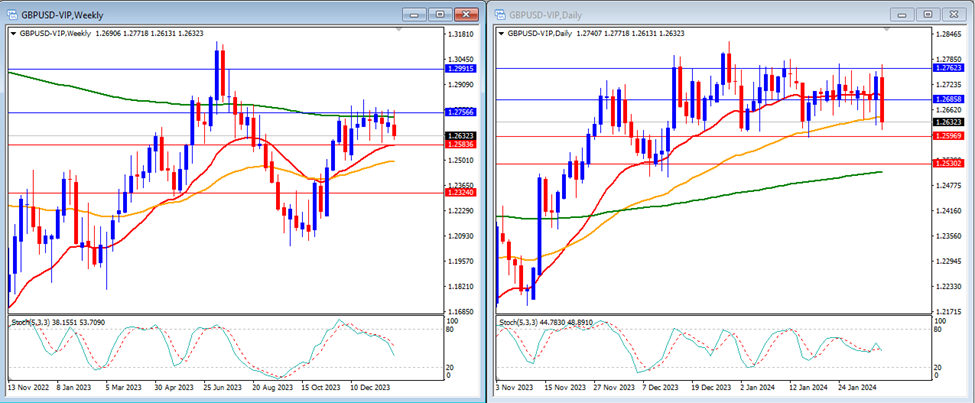
Last week, GBP/USD prices fell slightly and closed the week at 1.2632.
On the weekly timeframe, the Stochastic Indicator is moving lower in the middle. The price is trading above the 20 and 50-week moving averages and below the 200-week moving average.
Weekly resistance levels: 1.2756 and 1.2991.
Weekly support Levels: 1.2583 and 1.2324.
On the daily timeframe, the Stochastic Indicator is moving in the middle. Currently, the price is trading below the 20 and 50-day moving averages but remains above the 200-day moving average.
Daily resistance levels: 1.2685 and 1.2762.
Daily support levels: 1.2596 and 1.2530.
Conclusion: This week, we anticipate low volatility due to a lack of high-impact data releases from the US. Our analysts foresee a potential upward trend for GBP/USD, potentially reaching our resistance level at 1.2685.
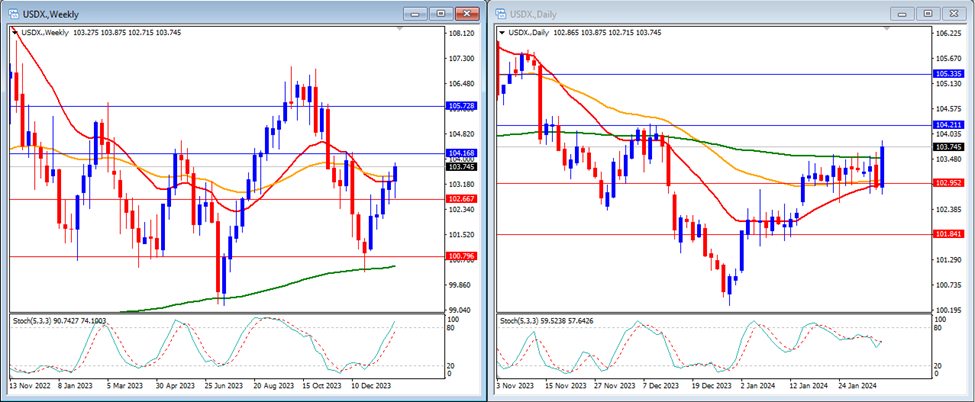
Last week, USDX prices rose and closed the week at 103.74.
On the weekly timeframe, the Stochastic Indicator is moving higher, targeting the overbought area. Currently, the price is trading above the 20, 50, and 200-week moving averages.
Weekly resistance levels: 104.16 and 105.72.
Weekly support Levels: 102.66 and 100.79.
On the daily timeframe, the Stochastic Indicator is moving lower in the middle. The price is currently trading above the 20, 50 and 200-day moving averages.
Daily resistance levels: 104.21 and 105.33.
Daily support levels: 102.95 and 101.84.
Conclusion: This week, we anticipate low volatility due to a lack of high-impact data releases from the US. Our analysts foresee a potential downward trend for the USD Index, potentially reaching our support level at 102.95.
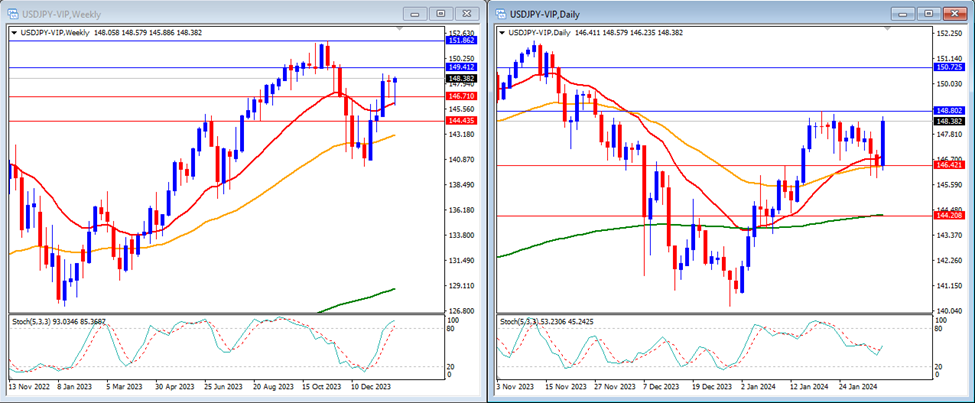
Last week, USD/JPY prices rose slightly and closed the week at 148.38.
On the weekly timeframe, the Stochastic Indicator is moving higher, targeting the overbought area. The price is currently trading above the 20, 50, and 200-week moving averages.
Weekly resistance levels: 149.41 and 151.86.
Weekly support Levels: 146.71 and 144.43.
On the daily timeframe, the Stochastic Indicator is moving lower in the middle. Currently, the price is above the 20, 50, and 200-day moving averages.
Daily resistance levels: 148.80 and 150.72.
Daily support levels: 146.42 and 144.20.
Conclusion: This week, we anticipate low volatility due to a lack of high-impact data releases from the US. Our analysts foresee a potential downward trend for USD/JPY, potentially reaching our support level at 146.42.
Make informed decisions with the most up-to-date and reliable financial data, exclusively provided by vtmarkets.com.