Spreads
Spreads
Spreads
Spreads
Spreads
Make informed decisions with the most up-to-date and reliable financial data, exclusively provided by vtmarkets.com.
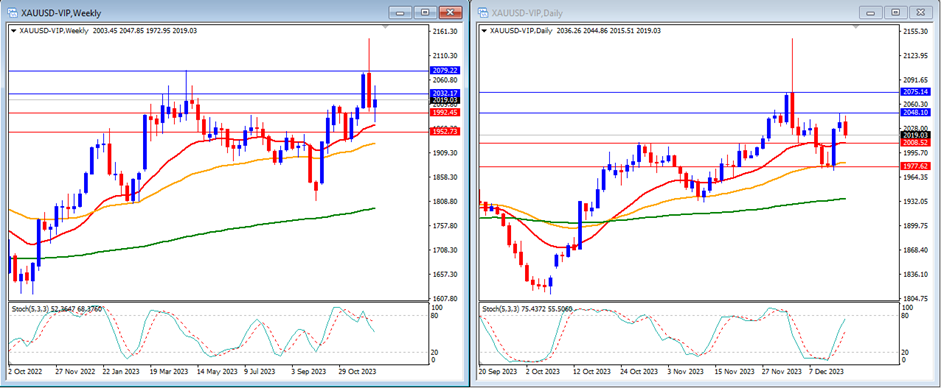
Last week, gold prices moved slightly higher and were able to reach above our resistance level, closing at $2,019.
On the weekly timeframe, the Stochastic Indicator appears to be attempting to exit the overbought area. Currently, gold is trading above the 20, 50, and 200-day moving averages.
Our weekly resistance levels are at $2,032 and $2,079, with support levels at $1,992 and $1,952.
On the daily timeframe, the Stochastic Indicator is trending higher in the middle targeting the overbought area, and the price of gold is currently above the 20, 50, and 200-day moving averages.
Our daily resistance levels are at $2,048 and $2,075, with support levels at $2,008 and $1,977.
Conclusion: This week, high volatility is anticipated due to a packed events schedule, including the US final GDP and core PCE price index. These data points might directly impact the price of the US Dollar and impact the XAU/USD pair. Our analysts expect Gold to potentially trend higher this week, potentially leading Gold to reach our resistance level at $2,048.
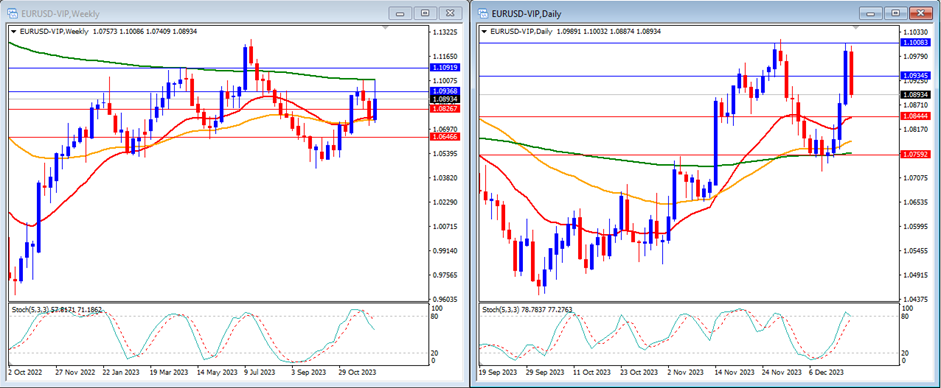
Last week, the EUR/USD pair broke above our resistance levels, closing the week at 1.0893.
On the weekly timeframe, the Stochastic Indicator is moving lower trying to exit from the overbought area. Currently, the price is trading above the 20 and 50-day moving averages but remains below the 200-day moving average.
Our weekly resistance levels stand at 1.0936 and 1.1091, with support levels at 1.0826 and 1.0646.
Looking at the daily timeframe, the Stochastic Indicator shows an upward trend reaching the overbought area. Simultaneously, the EUR/USD price is above the 20, 50, and 200-day moving averages.
Our daily resistance levels are at 1.0934 and 1.1008, while support levels are at 1.0844 and 1.0759.
Conclusion: This week, high volatility is anticipated due to a packed events schedule, including the US final GDP and core PCE price index. These data points might significantly impact the US Dollar. Our analysts anticipate a potential upward trend for EUR/USD, possibly driving EUR/USD toward our next resistance level at 1.0844.
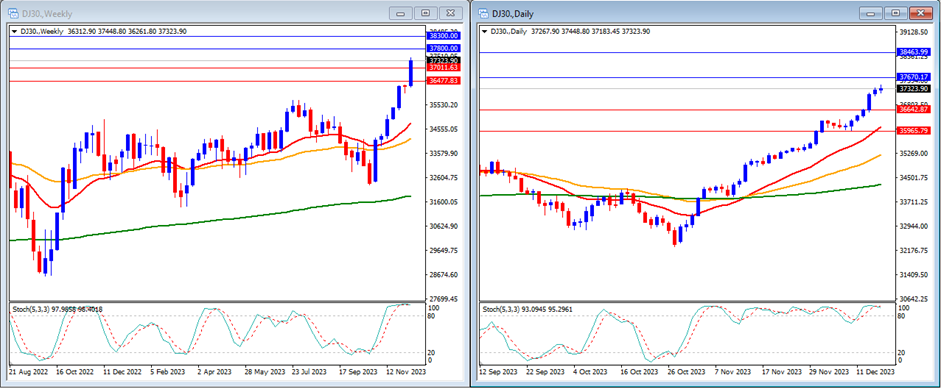
Last week, the DJ30 traded higher and was able to break above our resistance levels to reach a time high, closing the week at 37,323.
On the weekly timeframe, the Stochastic Indicator is showing an upward trend within the overbought territory. Currently, the index is trading above the 20, 50, and 200-day moving averages.
Our weekly resistance levels are identified at 37,800 and 38,300, with support levels at 37,011 and 36,477.
Examining the daily timeframe, the Stochastic Indicator moves inside the overbought area. Presently, the price is trading above the 20, 50, and 200-day moving averages.
Our daily resistance levels stand at 37,670 and 38,463, while support levels are at 36,642 and 35,965.
Conclusion: This week is expected to bring high volatility due to a dense events calendar, encompassing the US final GDP and core PCE price index. These factors hold the potential to significantly impact the stock market. Our analysts foresee a possible upward trend for the DJ30 this week, potentially driving it toward our next support level at 37,670.
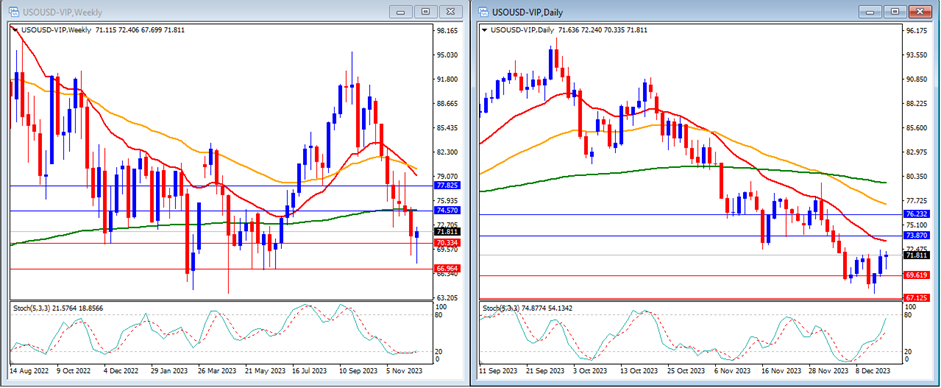
Last week, USO/USD moved slightly higher, closing the week at 71.81.
On the weekly timeframe, the Stochastic Indicator shows a downward trend, within the oversold territory. The price is trading below the 20, 50, and 200-day moving averages.
Our weekly resistance levels are set at 74.57 and 77.82, while support levels are at 70.33 and 66.96.
Looking at the daily timeframe, the Stochastic Indicator is moving higher targeting the overbought area, and the price is currently trading below the 20, 50, and 200-day moving averages.
Our daily resistance levels stand at 73.87 and 76.23, with support levels at 69.61 and 67.12.
Conclusion: We anticipate significant movements in the USO/USD price, influenced by the latest sentiments surrounding tensions in the Middle East. Our analysts foresee a potential downward movement for USO/USD this week, potentially driving it toward our next support level at 69.61.
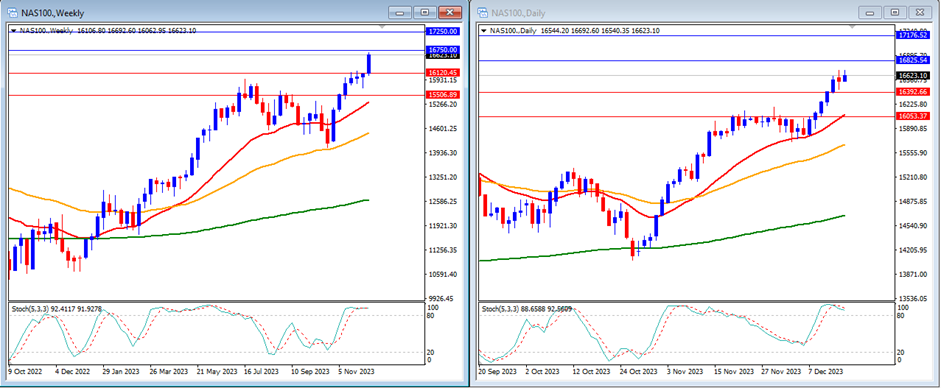
Last week, the NAS100 surged above previous resistance levels, closing the week at 16,623.
On the weekly timeframe, the Stochastic Indicator is currently situated within the overbought area, while the price continues to trade above the 20, 50, and 200-day moving averages.
Our weekly resistance levels are identified at 16,750 and 17,250, with support levels at 16,120 and 15,506.
Examining the daily timeframe, the Stochastic Indicator is ascending within the overbought area. Presently, the price remains above the 20, 50, and 200-day moving averages.
Our daily resistance levels stand at 16,825 and 17,176, while support levels are at 16,392 and 16,053.
Conclusion: This week is expected to bring high volatility due to a dense events calendar, encompassing the US final GDP and core PCE price index. These factors hold the potential to significantly impact the stock market. Our analysts foresee a possible upward trend for the NAS100 this week, potentially driving it toward our next support level at 16,825.
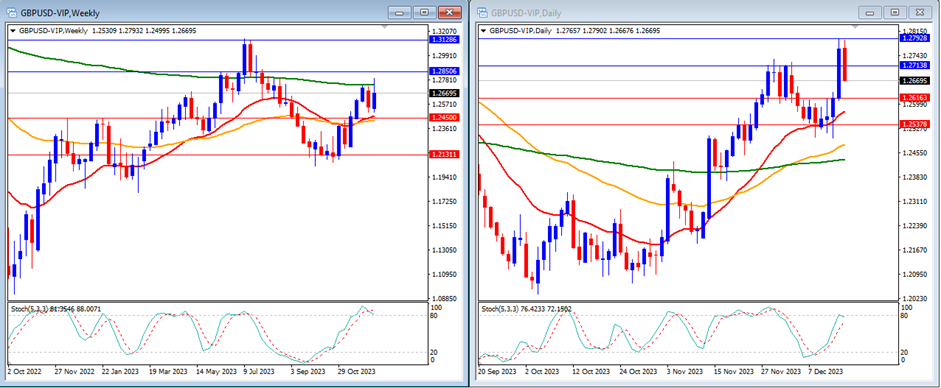
Last week, GBP/USD moved higher above our previous resistance level, closing at 1.2669.
On the weekly timeframe, the Stochastic Indicator shows an upward trend within the overbought area. The price is trading above the 20 and 50-day moving averages but remains below the 200-day moving average.
Our weekly resistance levels are identified at 1.2850 and 1.3128, while support levels are at 1.2450 and 1.2131.
Examining the daily timeframe, our Stochastic Indicator indicates an upward trend targeting the overbought area. Simultaneously, the price is trading above the 20, 50, and 200-day moving averages.
Our daily resistance levels stand at 1.2713 and 1.2792, while support levels are at 1.2616 and 1.2537.
Conclusion: This week is expected to bring high volatility due to a busy events calendar, including the US final GDP and core PCE price index while also the UK annual CPI and retail sales data. These data points could significantly impact the GBP/USD pair. Our analysts foresee a potential upward trend for GBP/USD this week, potentially driving GBP/USD toward our next resistance level at 1.2713.
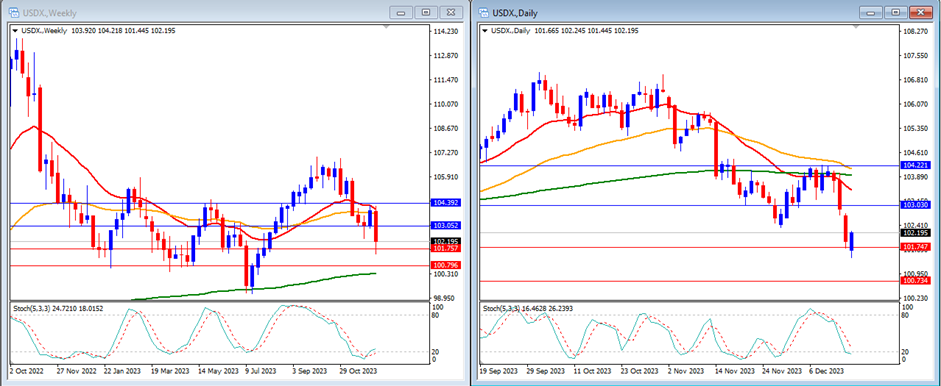
Last week, the USD Index dropped lower, breaking below previous support levels and closing the week at 102.19.
On the weekly timeframe, it’s evident that the Stochastic Indicator is attempting to move out of the oversold area. Presently, the price is trading below the 20 and 50-day moving averages but remains above the 200-day moving average.
Our weekly resistance levels are positioned at 103.05 and 104.39, with support levels identified at 101.75 and 100.79.
Examining the daily timeframe, the Stochastic Indicator indicates a lower movement targeting the oversold area. The price is currently trading below the 20, 50 and 200-day moving averages.
Our daily resistance levels stand at 103.03 and 104.22, while support levels are at 101.74 and 100.73.
Conclusion: This week anticipates high volatility due to a busy events schedule, including the US final GDP and the US core PCE price index. These factors could significantly impact the US Dollar’s price. Our analysts anticipate a potential downward trend for the USD Index this week, potentially driving the USD Index toward our support level at 101.74.
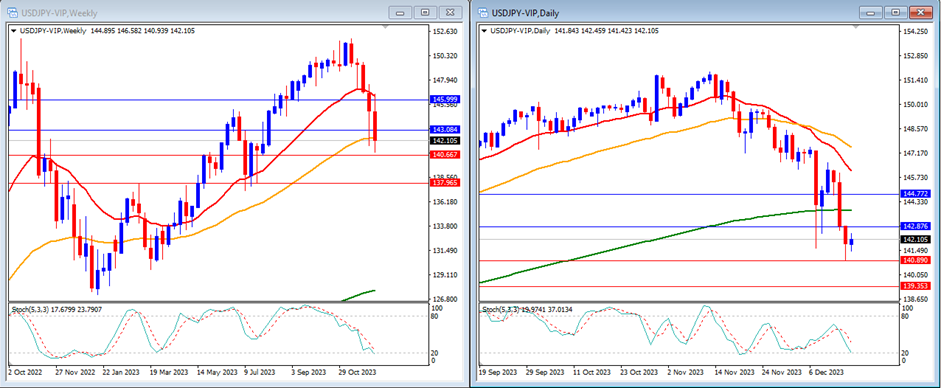
Last week, USD/JPY declined to fall below previous support levels, closing the week at 142.10.
On the weekly timeframe, the Stochastic Indicator indicates a downward movement, aiming for the oversold area. The price is presently trading below the 20-day moving average, around the 50-day moving average, but remains above the 200-day moving average.
Our weekly resistance levels are set at 143.08 and 145.99, while support levels are at 140.66 and 137.96.
Looking at the daily timeframe, the Stochastic Indicator also shows a downward trend targeting the oversold area. Currently, the price is trading below the 20-day, 50, and 200-day moving averages.
Our daily resistance levels stand at 142.87 and 144.77, with support levels at 140.89 and 139.35.
Conclusion: This week anticipates high volatility due to a packed events calendar, encompassing the Bank of Japan rate decisions, the US core PCE price index, and the US final GDP. These factors have the potential to significantly impact the US Dollar and Japanese Yen. Our analysts foresee a potential downward trend for the USD/JPY this week, potentially driving it toward our next support level at 140.89.
Make informed decisions with the most up-to-date and reliable financial data, exclusively provided by vtmarkets.com.