Spreads
Spreads
Spreads
Spreads
Spreads
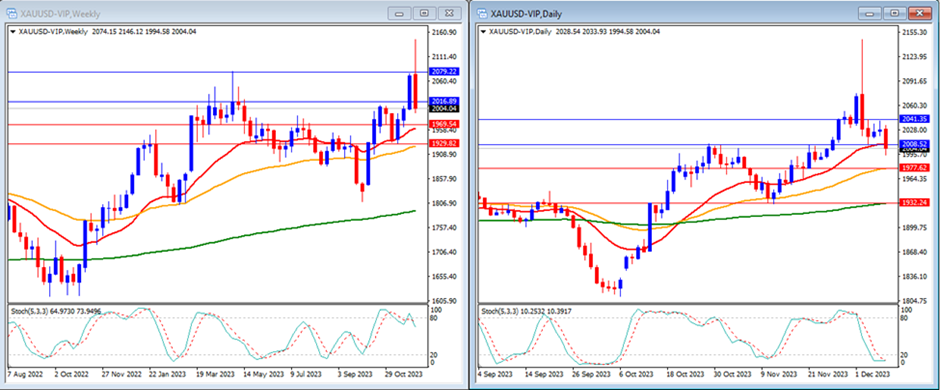
Last week, gold prices reached an all-time high of $2,146, surpassing our resistance levels, but then declined throughout the week, closing at $2,004.
On the weekly timeframe, the Stochastic Indicator appears to be attempting to exit the overbought area. Currently, gold is trading above the 20, 50, and 200-day moving averages.
Our weekly resistance levels are at $2,016 and $2,079, with support levels at $1,969 and $1,929.
On the daily timeframe, the Stochastic Indicator is trending lower within the oversold area, and the price of gold is currently approaching the 20-day moving average but remains above the 50 and 200-day moving averages.
Our daily resistance levels are at $2,008 and $2,041, with support levels at $1,977 and $1,932.
Conclusion: This week, high volatility is anticipated due to a packed events schedule, including the Fed rate decisions (as well as those of the BoE and ECB) and US inflation data in CPI and PPI reports, alongside US retail sales data. These data points might directly impact the price of Gold. Our analysts expect Gold to potentially trend higher this week, particularly if a dovish statement from the Fed results in a weaker US Dollar, potentially leading Gold to reach our resistance level at $2,041.
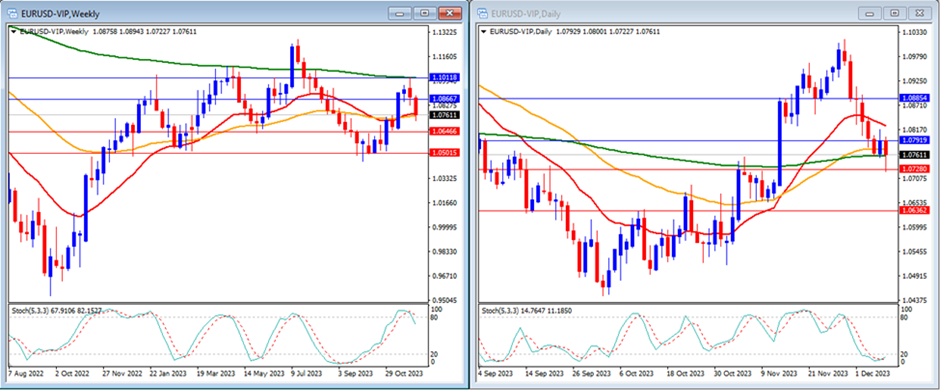
Last week, the EUR/USD pair broke below our support levels, closing the week at 1.0761.
On the weekly timeframe, the Stochastic Indicator is attempting to cross lower, signaling a potential exit from the overbought area. Currently, the price is trading around the 20 and 50-day moving averages but remains below the 200-day moving average.
Our weekly resistance levels stand at 1.0866 and 1.1011, with support levels at 1.0646 and 1.0501.
Looking at the daily timeframe, the Stochastic Indicator shows a downward trend within the oversold area. Simultaneously, the EUR/USD price is below the 20 and 50-day moving averages and has touched the 200-day moving average.
Our daily resistance levels are at 1.0791 and 1.0885, while support levels are at 1.0728 and 1.0636.
Conclusion: This week, high volatility is anticipated due to a packed events schedule, including the Fed and ECB rate decisions, US inflation data in CPI and PPI reports, alongside US retail sales data, and EU PMI figures. These data points might significantly impact the EUR/USD pair. Our analysts anticipate a potential downward trend for EUR/USD this week, particularly if a dovish statement from the ECB leads to a weaker EURO, possibly driving EUR/USD towards our next support level at 1.0646.
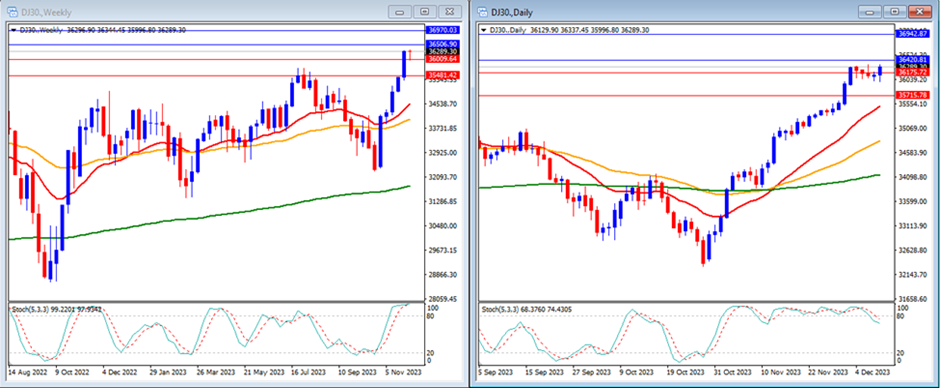
Last week, the DJ30 traded in consolidation mode and closed the week within the range of our support and resistance levels at 36,289.
On the weekly timeframe, the Stochastic Indicator is showing an upward trend within the overbought territory. Currently, the index is trading above the 20, 50, and 200-day moving averages.
Our weekly resistance levels are identified at 36,506 and 36,970, with support levels at 36,009 and 35,481.
Examining the daily timeframe, the Stochastic Indicator indicates overbought conditions with a potential to exit. Presently, the price is trading above the 20, 50, and 200-day moving averages.
Our daily resistance levels stand at 36,420 and 36,942, while support levels are at 36,175 and 35,715.
Conclusion: This week, high volatility is anticipated due to a busy events schedule, including the Fed rate decisions, US inflation data in CPI and PPI reports, and US retail sales data. These data points could significantly impact the stock market. Our analysts foresee a potential downward trend for the DJ30 this week, potentially driving it toward our next support level at 36,009.
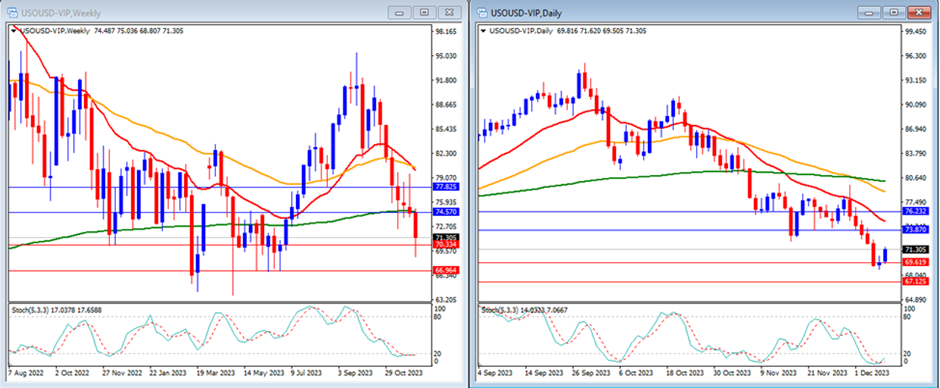
Last week, USO/USD fell below our support levels, closing the week at 71.30.
On the weekly timeframe, the Stochastic Indicator shows a downward trend, entering the oversold territory. The price is trading below the 20, 50, and 200-day moving averages.
Our weekly resistance levels are set at 74.57 and 77.82, while support levels are at 70.33 and 66.96.
Looking at the daily timeframe, the Stochastic Indicator is within the oversold area, and the price is currently trading below the 20, 50, and 200-day moving averages.
Our daily resistance levels stand at 73.87 and 76.23, with support levels at 69.61 and 67.12.
Conclusion: We anticipate significant movements in the USO/USD price, influenced by the latest sentiments surrounding tensions in the Middle East and the potential impact of the Fed’s rate decisions on the US Dollar. Our analysts foresee a potential upward movement for USO/USD this week, potentially driving it toward our next resistance level at 73.87.
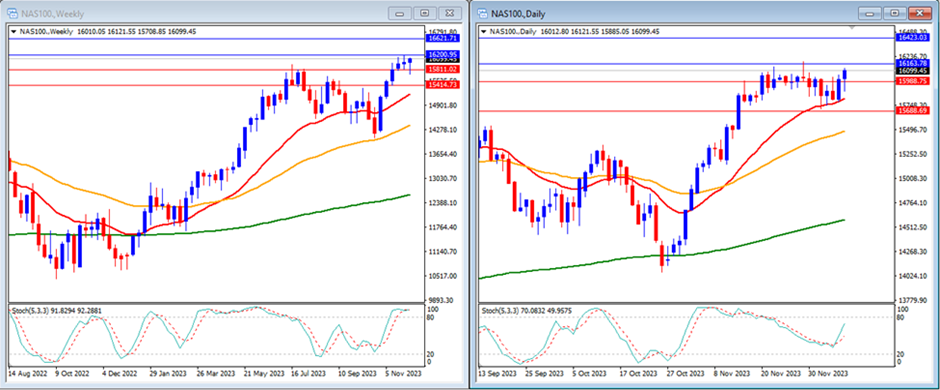
Last week, the NAS100 surged above previous resistance levels, closing the week at 16,099.
On the weekly timeframe, the Stochastic Indicator is currently situated within the overbought area, while the price continues to trade above the 20, 50, and 200-day moving averages.
Our weekly resistance levels are identified at 16,200 and 16,621, with support levels at 15,811 and 15,414.
Examining the daily timeframe, the Stochastic Indicator is ascending within the mid-range. Presently, the price remains above the 20, 50, and 200-day moving averages.
Our daily resistance levels stand at 16,163 and 16,423, while support levels are at 15,988 and 15,688.
Conclusion: This week is expected to bring high volatility due to a dense events calendar, encompassing the Fed rate decisions, US inflation data in CPI and PPI reports, and US retail sales data. These factors hold the potential to significantly impact the stock market. Our analysts foresee a possible downward trend for the NAS100 this week, potentially driving it toward our next support level at 15,811.
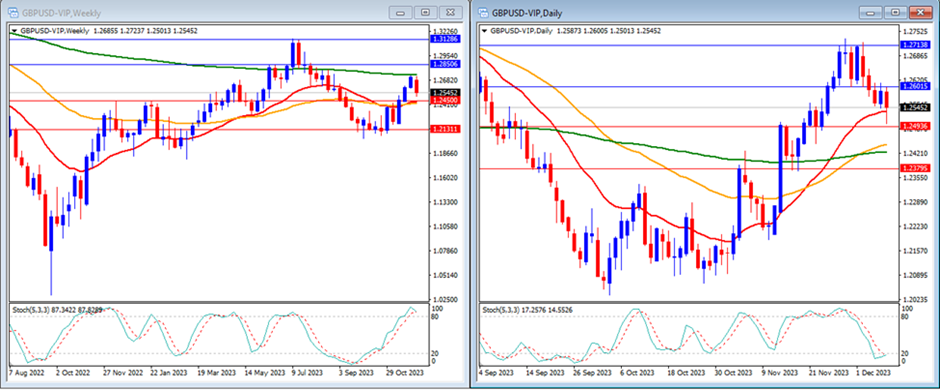
Last week, GBP/USD dropped below previous support levels, closing at 1.2545.
On the weekly timeframe, the Stochastic Indicator shows an upward trend within the overbought area. The price is trading above the 20 and 50-day moving averages but remains below the 200-day moving average.
Our weekly resistance levels are identified at 1.2850 and 1.3128, while support levels are at 1.2450 and 1.2131.
Examining the daily timeframe, our Stochastic Indicator indicates a downward trend around the oversold area. Simultaneously, the price is trading above the 20, 50, and 200-day moving averages.
Our daily resistance levels stand at 1.2601 and 1.2713, while support levels are at 1.2493 and 1.2379.
Conclusion: This week is expected to bring high volatility due to a busy events calendar, including the Fed and BOE rate decisions, US inflation data in CPI and PPI reports, alongside US retail sales data, and UK PMI figures. These data points could significantly impact the GBP/USD pair. Our analysts foresee a potential downward trend for GBP/USD this week, especially if a dovish statement from the BOE results in a weaker British Pound, potentially driving GBP/USD towards our next support level at 1.2450.
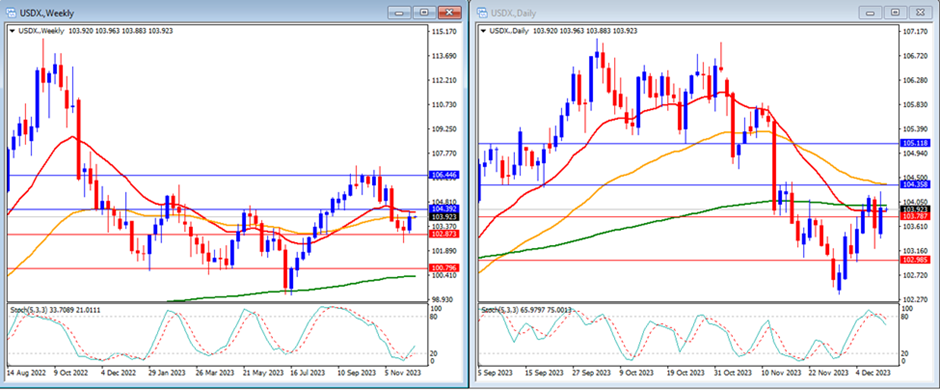
Last week, the USD Index surged higher, approaching previous resistance levels and closing the week at 103.92.
On the weekly timeframe, it’s evident that the Stochastic Indicator is attempting to move out of the oversold area. Presently, the price is trading below the 20-day moving average, near the 50-day moving average, but remains above the 200-day moving average.
Our weekly resistance levels are positioned at 104.39 and 106.44, with support levels identified at 102.87 and 100.79.
Examining the daily timeframe, the Stochastic Indicator indicates an exit from the overbought area. The price is currently trading around the 20-day moving average but remains below the 50 and 200-day moving averages.
Our daily resistance levels stand at 104.35 and 105.11, while support levels are at 103.78 and 102.98.
Conclusion: This week anticipates high volatility due to a busy events schedule, including the Fed rate decisions, as well as those of the BoE and ECB, and the release of US inflation data in CPI and PPI reports, alongside US retail sales data. These factors could significantly impact the US Dollar’s price. Our analysts anticipate a potential downward trend for the USD Index this week, especially if a dovish statement from the Fed leads to a weaker US Dollar, potentially driving the USD Index toward our support level at 103.78.
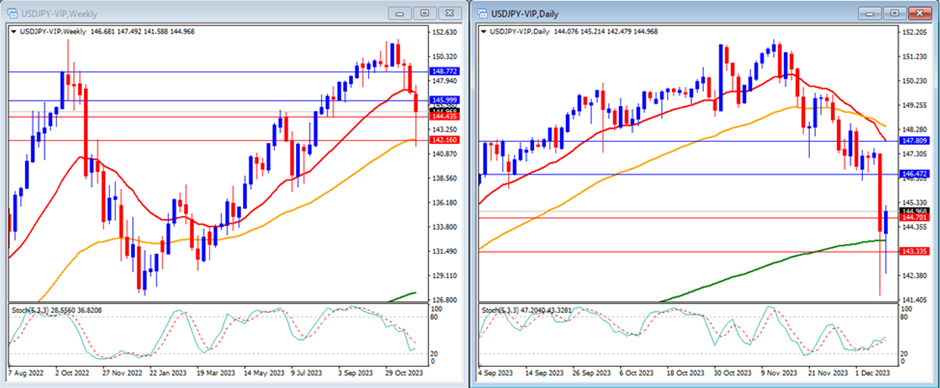
Last week, USD/JPY declined to fall below previous support levels, closing the week at 144.96.
On the weekly timeframe, the Stochastic Indicator indicates a downward movement, aiming for the oversold area. The price is presently trading below the 20-day moving average while remaining above the 50-day and 200-day moving averages.
Our weekly resistance levels are set at 145.99 and 148.77, while support levels are at 144.43 and 142.16.
Looking at the daily timeframe, the Stochastic Indicator also shows a downward trend targeting the oversold area. Currently, the price is trading below the 20-day and 50-day moving averages but still above the 200-day moving average.
Our daily resistance levels stand at 146.47 and 147.80, with support levels at 144.70 and 143.33.
Conclusion: This week anticipates high volatility due to a packed events calendar, encompassing the Fed rate decisions, US inflation data in CPI and PPI reports, and US retail sales data. These factors have the potential to significantly impact the US Dollar. Our analysts foresee a potential downward trend for the USD/JPY this week, potentially driving it toward our next support level at 144.43.
Make informed decisions with the most up-to-date and reliable financial data, exclusively provided by vtmarkets.com.