Spreads
Spreads
Spreads
Spreads
Spreads
Make informed decisions with the most up-to-date and reliable financial data, exclusively provided by vtmarkets.com.
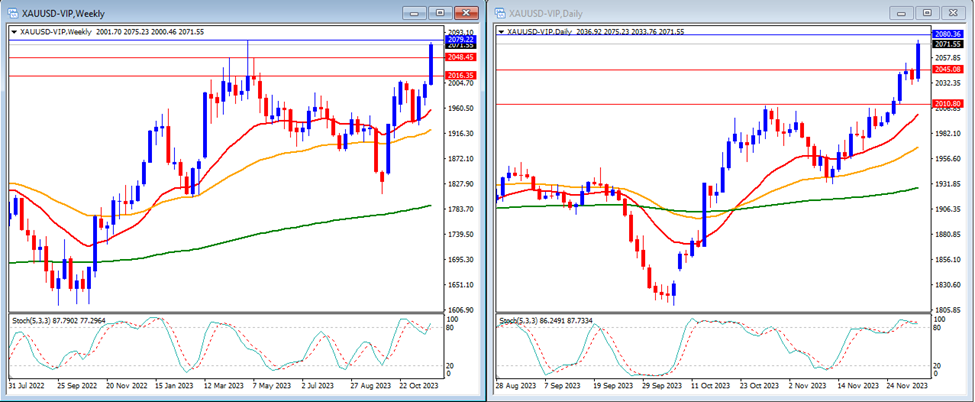
Last week, gold prices rose, breaking above our resistance levels and closing the week at $2,071.
On the weekly timeframe, the Stochastic Indicator appears to be fluctuating within the overbought zone. Currently, gold is trading above the 20, 50, and 200-day moving averages.
Our weekly resistance levels are at $2,079, with support levels at $2,048 and $2,016.
On the daily timeframe, the Stochastic Indicator is trending upwards within the overbought territory, and the price of gold is currently trading above the 20, 50, and 200-day moving averages.
Our daily resistance levels are at $2,080, with support levels at $2,045 and $2,010.
Conclusion: This week, high volatility is anticipated due to the significant impact of the US Jobs Report. Traders should also monitor tensions in the Middle East, which are expected to notably affect the gold market. A modest correction in gold prices is projected this week, with prices forecasted to reach our support level at $2,045.
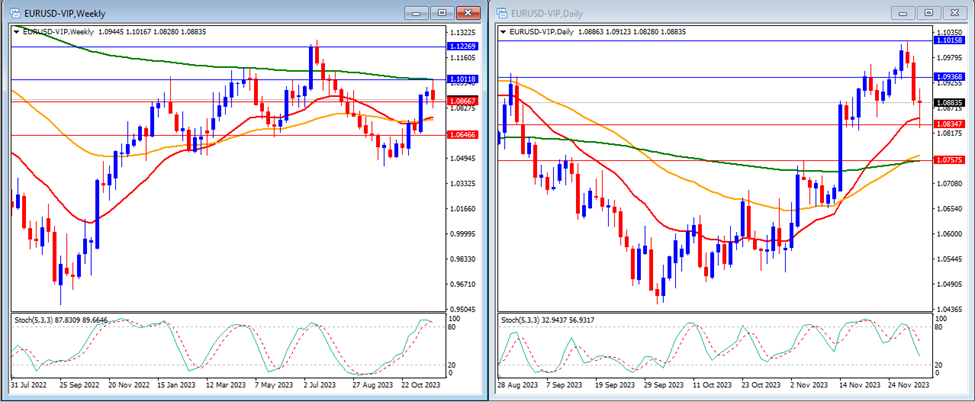
Last week, the EUR/USD pair broke below the daily resistance level, closing the week at 1.0883.
On the weekly timeframe, the Stochastic Indicator is trending higher within the overbought area. The price is currently trading above the 20 and 50-day moving averages, yet remains below the 200-day moving average.
Our weekly resistance levels are at 1.1011 and 1.1226, with support levels at 1.0866 and 1.0646.
On the daily timeframe, the Stochastic Indicator is trending lower, targeting the oversold area. Meanwhile, the price of EUR/USD is trading above the 20, 50, and 200-day moving averages.
Our daily resistance levels are at 1.0936 and 1.1015, while the support levels are at 1.0834 and 1.0757.
Conclusion: We expect a week of significant volatility for EUR/USD, driven by impactful news from the US jobs report. The EUR/USD is anticipated to climb modestly, potentially approaching the 1.1 price level.
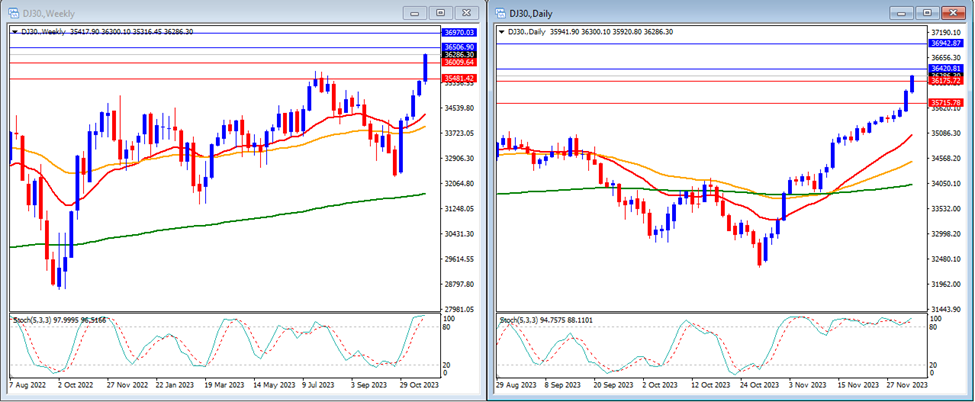
Last week, the DJ30 broke above resistance levels, closing the week at 36,286.
On the weekly timeframe, the Stochastic Indicator is trending upwards within the overbought territory. The index is currently trading above the 20, 50, and 200-day moving averages.
Our weekly resistance levels are at 36,506 and 36,970, with support levels at 36,009 and 35,481.
On the daily timeframe, the Stochastic Indicator is within the overbought area. The price is currently trading above the 20, 50, and 200-day moving averages.
Our daily resistance levels are 36,420 and 36,942, with support levels at 36,175 and 35,715.
Conclusion: The US stock market is expected to face a week of high volatility due to high-impact news from the US jobs report. We anticipate that the DJ30 may move higher, influenced by market trends favouring US dollar weakness, potentially targeting our resistance level of 36,506.
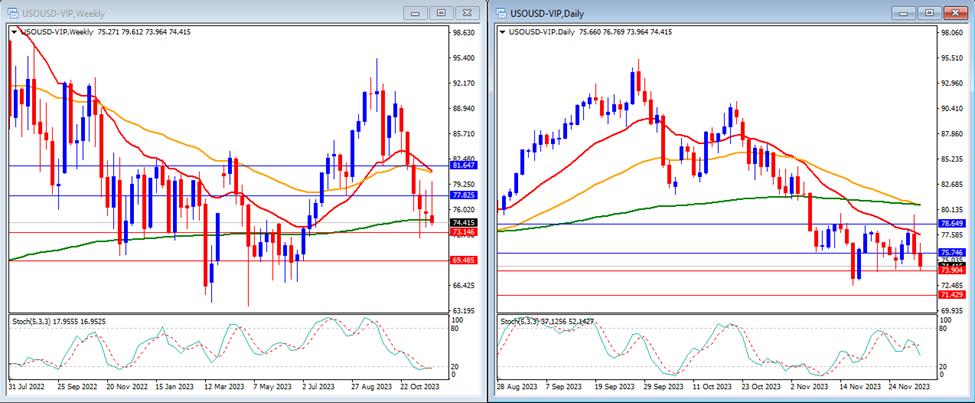
Last week, USO/USD reached our support levels and closed the week at 74.41.
On the weekly timeframe, the Stochastic Indicator is observed to be trending downwards toward the oversold territory. The price is trading below both the 20-day and 50-day moving averages, yet it remains close to the 200-day moving average.
Our weekly resistance levels are 77.82 and 81.64, with support levels at 73.14 and 69.48.
On the daily timeframe, the Stochastic Indicator is moving in the middle with no clear direction, and the price is currently trading below the 20, 50, and 200-day moving averages.
Our daily resistance levels are at 75.74 and 78.64, while support levels are at 73.90 and 71.42.
Conclusion: We anticipate more significant movement in USO/USD price, influenced by the latest sentiments around tensions in the Middle East and OPEC-JMMSC meetings. A possibility of a downward trend exists, with USO/USD potentially reaching our next support level at 73.14.
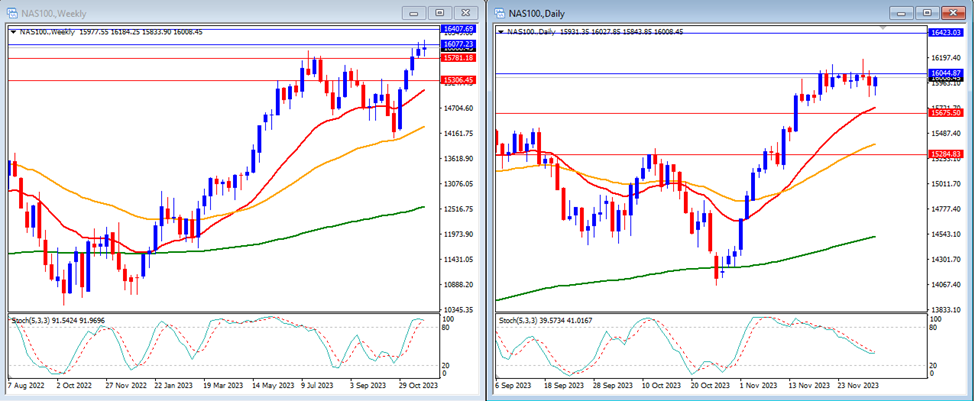
Last week, the NAS100 broke above previous resistance levels, closing the week at 16,008.
On the weekly timeframe, the Stochastic Indicator is currently moving higher inside the overbought area. The price is currently trading above the 20, 50, and 200-day moving averages.
Our weekly resistance levels are 16,077 and 16,407, with support levels at 15,781 and 15,306.
On the daily timeframe, the Stochastic Indicator is moving flat slightly lower in the middle. The price is currently trading above the 20, 50, and 200-day moving averages.
Our daily resistance levels are currently at 16,044 and 16,423, while support levels are at 15,675 and 15,284.
Conclusion: The US stock market is expected to face a week of high volatility due to high-impact news from the US jobs report. We anticipate that the NAS100 may trend higher, influenced by the market’s inclination towards US dollar weakness, potentially hitting our next resistance level of 16,077.
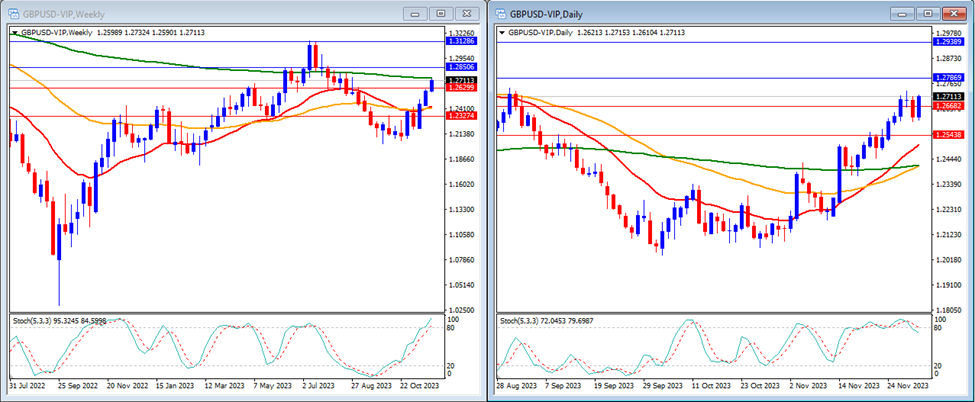
Last week, GBP/USD broke above previous resistance levels. The pair closed the week at 1.2711.
On the weekly timeframe, the Stochastic Indicator is currently trending higher towards the overbought area. The price is trading above the 20 and 50-day moving averages but remains below the 200-day moving average.
Our weekly resistance levels are at 1.2850 and 1.3128, while support levels are at 1.2629 and 1.2327.
On the daily timeframe, our Stochastic Indicator is trending higher around the overbought area. Meanwhile, the price is trading above the 20, 50, and 200-day moving averages.
Our daily resistance levels are now at 1.2786 and 1.2938, while support levels are at 1.2668 and 1.2543.
Conclusion: We expect high volatility in GBP/USD this week due to high-impact news from the US jobs report. We anticipate that GBP/USD will continue its upward movement, potentially surpassing our resistance level at 1.2786.
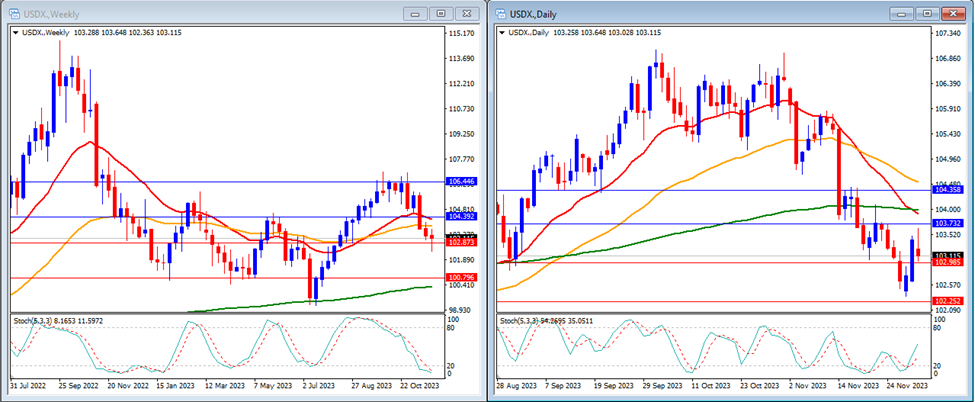
Last week, the USD Index moved lower near previous support levels, closing the week at 103.11.
On the weekly timeframe, it can be observed that the Stochastic Indicator is trending lower towards the oversold area. The price is currently trading below the 20 and 50-day moving averages but remains above the 200-day moving average.
Our weekly resistance levels are 104.39 and 106.44, with support levels at 102.87 and 100.79.
On the daily timeframe, the Stochastic Indicator is trending slightly higher just above the oversold area. The price is trading below the 20, 50 and 200-day moving averages.
Our daily resistance levels are 103.73 and 104.35, with support levels at 102.98 and 102.25.
Conclusion: We expect high volatility in the USD Index this week as we will have the US jobs report to be released on Friday. We anticipate the USD Index to trend lower, potentially reaching our next support level at 102.87.
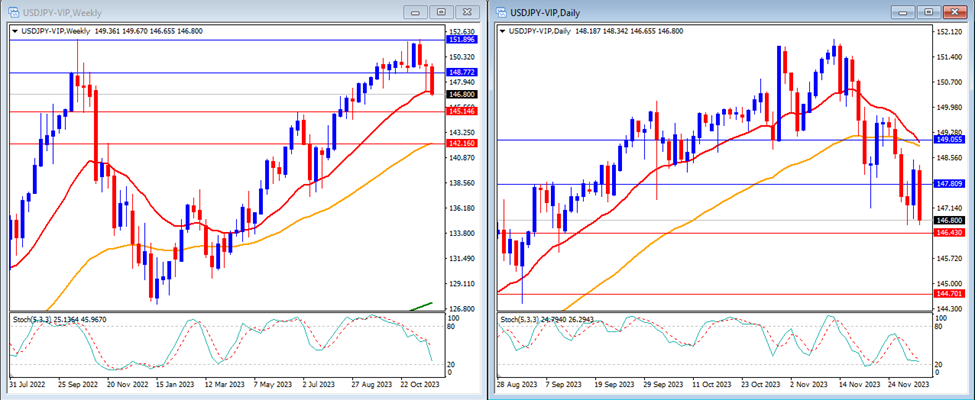
Last week, USD/JPY moved lower to reach below previous support levels and closed the week at 146.80.
On the weekly timeframe, it can be observed that the Stochastic Indicator is moving lower targeting the oversold area. The price is currently trading around the 20-day, while still above 50-day, and 200-day moving averages.
Our weekly resistance levels are 148.77 and 151.89, with support levels at 145.14 and 142.16.
On the daily timeframe, the Stochastic Indicator is trending lower targeting the oversold area. The price is currently trading below the 20-day and 50-day moving averages but remains above the 200-day moving averages.
Our daily resistance levels are currently at 147.80 and 149.05, while the support levels are at 146.43, and 144.70.
Conclusion: We anticipate a week of high volatility for USD/JPY due to high-impact news from the US jobs report. However, the market remains vigilant for updates on Middle East tensions and potential interventions by the Bank of Japan in the currency market. We expect the pair to move lower—as market sentiment currently burdens the US dollar—potentially reaching our support level at 146.43.
Make informed decisions with the most up-to-date and reliable financial data, exclusively provided by vtmarkets.com.