Spreads
Spreads
Spreads
Spreads
Spreads
Make informed decisions with the most up-to-date and reliable financial data, exclusively provided by vtmarkets.com.
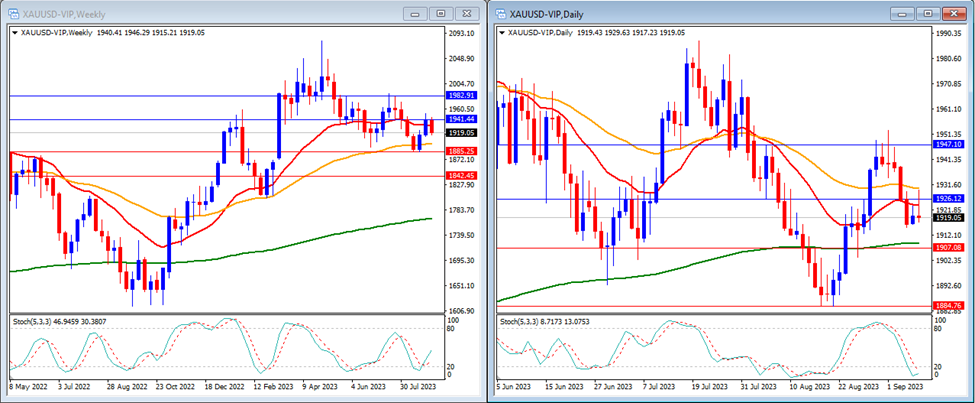
Last week, gold moved lower and successfully reached our daily support level. Gold closed the week at $1,919.
On the weekly timeframe, we observe that the Stochastic Indicator is ascending, positioned just above the oversold area. Additionally, the gold price is currently below the 20-period moving average but above the 50 and 200-period moving averages.
Our weekly resistance levels are at $1,941 and $1,982, with support levels at $1,885 and $1,842.
On the daily timeframe, the Stochastic Indicator is within the oversold area, while the price is currently below the 20 and 50-period moving averages but still above the 200-period moving average.
Our daily resistance levels are at $1,926 and $1,947, with support levels at $1,907 and $1,884.
Conclusion: We will receive high-impact data from the US this week, which might lead to negative sentiment for gold. The market anticipates that the inflation and retail sales data will strengthen the US Dollar. Our expectation is for gold to move lower, with an attempt to reach our daily support level at $1,907.
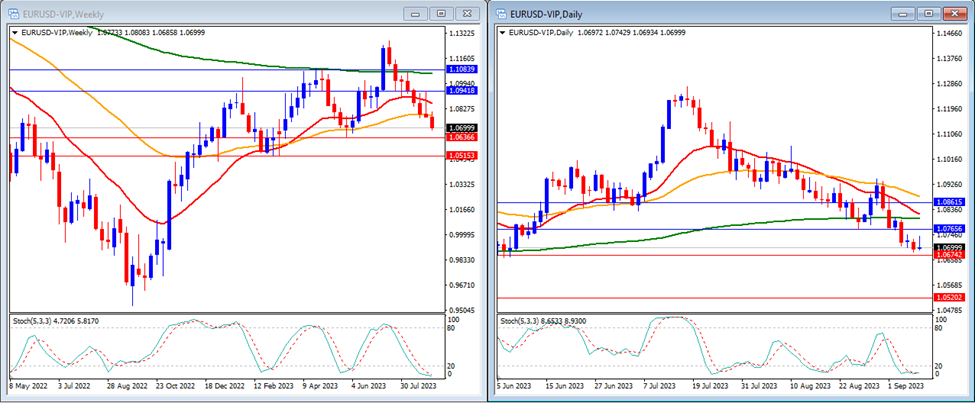
Last week, EURUSD moved lower and dipped below our support levels, closing the week at 1.0699.
On the weekly timeframe, the Stochastic Indicator is descending within the oversold area. Additionally, the price is currently trading below the 20, 50, and 200-period moving averages.
Our weekly resistance levels are at 1.0941 and 1.1083, with support levels at 1.0636 and 1.0515.
On the daily timeframe, the Stochastic Indicator is moving inside the oversold area, while the price is moving below the 20, 50 and 200-period moving averages.
Our daily resistance levels are at 1.0765 and 1.0861, while the support levels are at 1.0674 and 1.0520.
Conclusion: This week, we anticipate high volatility for EURUSD due to the ECB’s interest rate decision and the release of inflation and retail sales data from the US. The current market sentiment is not in favour of the EUR, but there is a possibility of slight positive movement as the ECB is forecasted to raise interest rates. Our expectation is for EURUSD to experience a modest upward movement this week, potentially reaching our resistance level at 1.0765.
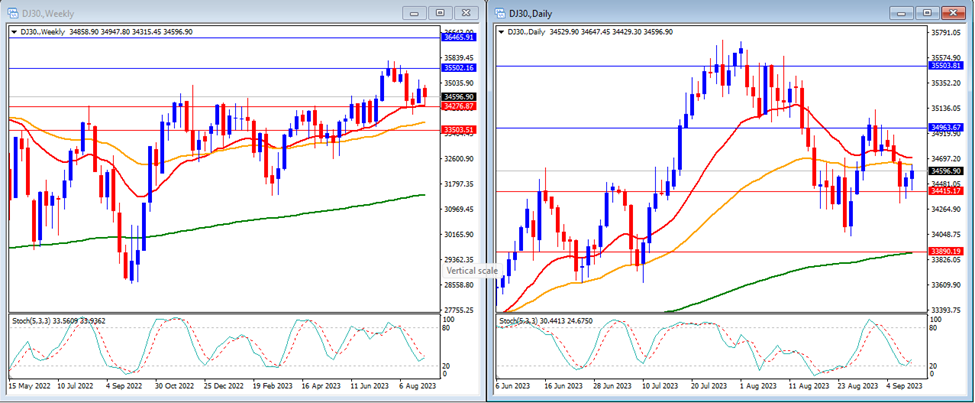
Last week, the DJ30 moved slightly lower and was able to reach our support levels. The DJ30 closed the week higher at 34,596.
On the weekly timeframe, it is noticeable that the Stochastic Indicator is descending, aiming for the oversold area. Furthermore, the price is presently trading above the 20, 50, and 200-period moving averages.
Our weekly resistance levels are at 35,502 and 36,465, with support levels at 34,276 and 33,503.
On the daily timeframe, the stochastic indicator is attempting to reverse its direction, moving higher just above the oversold area. Additionally, the price is currently trading below the 20 and 50-period moving averages but remains above the 200-period moving average.
Our daily resistance levels are 34,963 and 35,503, with support levels at 34,415 and 33,890.
Conclusion: The US stock market is expected to experience a week of high volatility due to the upcoming release of inflation and retail sales data in the US. There is a possibility of a modest downward movement in the DJ30, potentially reaching our support level at 34,415.
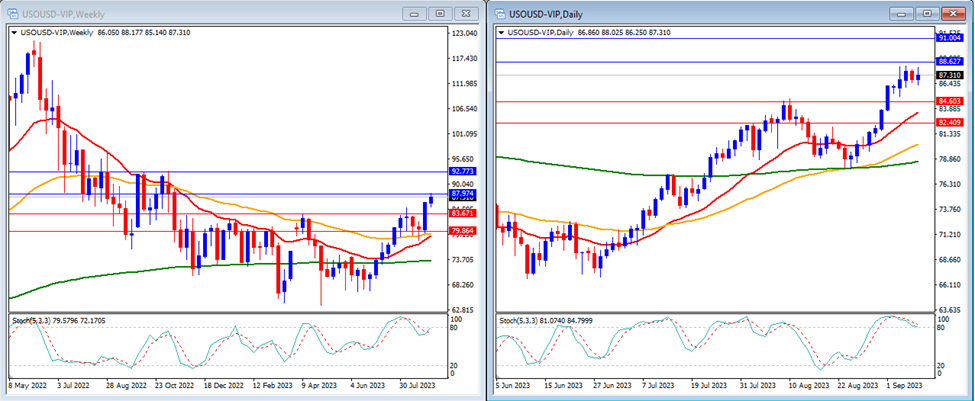
Last week, USOUSD (Oil) moved higher and successfully broke above our resistance levels, with the pair closing the week at 87.31.
On the weekly timeframe, it’s evident that the Stochastic Indicator is displaying a flat trend just below the overbought area. The price is presently trading above the 20, 50, and 200-period moving averages.
Our weekly resistance levels are 87.97 and 92.77, with support levels at 83.67 and 79.86.
On the daily timeframe, the Stochastic Indicator is moving inside the overbought area. The price is now moving above the 20, 50 and 200-period moving averages.
Our daily resistance levels are at 88.62 and 91.00, while support levels are at 84.60 and 82.40.
Conclusion: Based on the latest sentiment regarding USOUSD, we anticipate another strong upward movement. There’s a possibility of further gains, with USOUSD potentially reaching our next resistance level at 87.97.
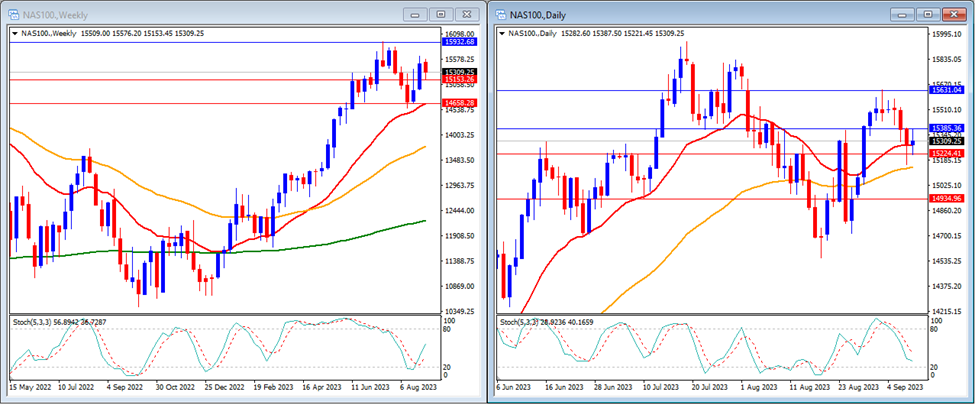
Last week, the NAS100 moved lower and successfully reached our support level, with the NAS100 closing the week at a lower level of 15,309.
On the weekly timeframe, it’s noticeable that the Stochastic Indicator is reversing its direction, moving higher just above the oversold area. The price is currently trading above the 20, 50, and 200-period moving averages.
Our weekly resistance levels are at 15,932 and 16,440, with support levels at 15,153 and 14,658.
On the daily timeframe, the stochastic indicator is moving lower targeting the oversold area. The price is still moving above the 20, 50 and 200-period moving averages.
Our daily resistance levels are currently at 15,385 and 15,631, while support levels are at 15,224 and 14,934.
Conclusion: The US stock market is expected to undergo a week of high volatility due to the upcoming release of inflation and retail sales data in the US. There is a possibility of a modest downward movement in the NAS100, potentially reaching our support level at 15,153.
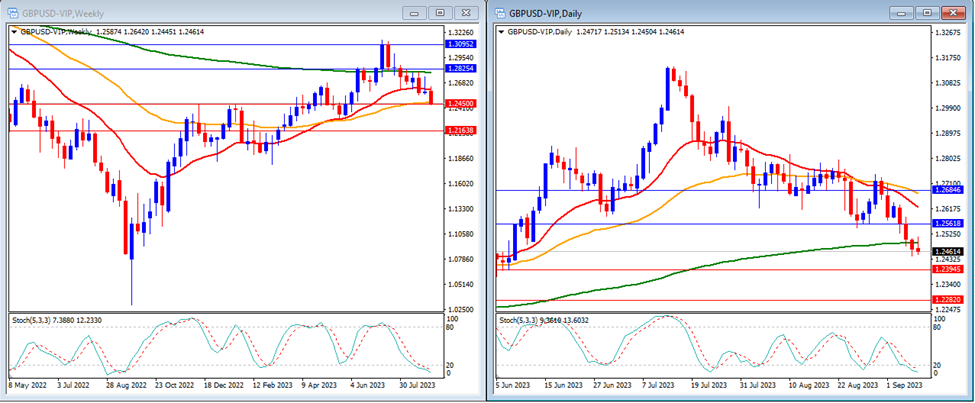
Last week, GBPUSD moved slightly lower and successfully reached our weekly support level, with GBPUSD closing the week at 1.2461.
On the weekly timeframe, the Stochastic Indicator is moving lower inside the oversold area. The price is currently moving at the 50, but below the 20 and 200-period moving averages.
Our weekly resistance levels are at 1.2825 and 1.3095, while support levels are at 1.2450 and 1.2163.
On the daily timeframe, our stochastic indicator is moving lower entering the oversold area. The price is currently moving below the 20, 50, and 200-period moving averages.
Our daily resistance levels are now at 1.2561 and 1.2684, while support levels are at 1.2394 and 1.2282.
Conclusion: This week, we anticipate high volatility in GBPUSD due to several high-impact data releases from both the UK and the US. We expect the potential for GBPUSD to experience upward movement, with the possibility of reaching our resistance level at 1.2561.
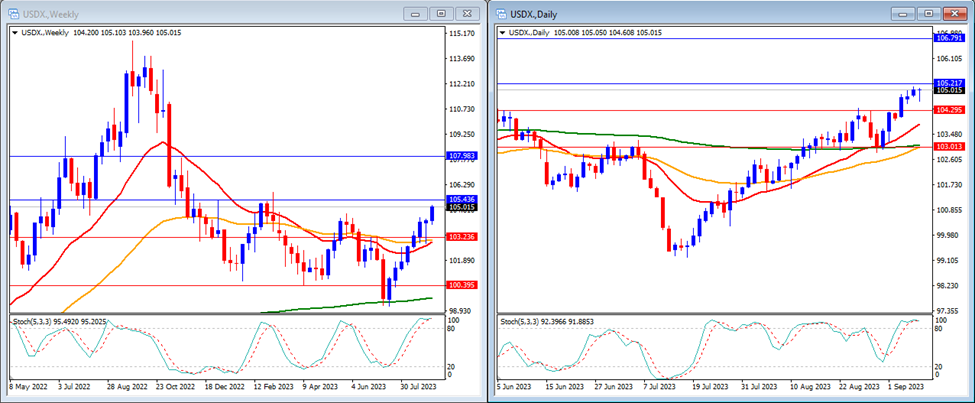
Last week, the USD Index moved higher and was able to reach our resistance levels. The USD Index closed the week at 105.01.
On the weekly timeframe, we see that the Stochastic Indicator is moving inside the overbought area. The price is currently above the 20, 50 and 200-period moving averages.
Our weekly resistance levels are at 105.43 and 107.98, with support levels at 103.23 and 100.39.
On the daily timeframe, the Stochastic Indicator is moving flat inside the overbought area. The price is now moving above the 20, 50 and 200-period moving averages.
Our daily resistance levels are at 105.21 and 106.79, with support levels at 104.29 and 103.01.
Conclusion: For this week, we expect high volatility in the USD Index due to high-impact data releases from the US. We anticipate the potential for a higher movement in the USD Index, with the possibility of reaching our resistance level at 105.43.
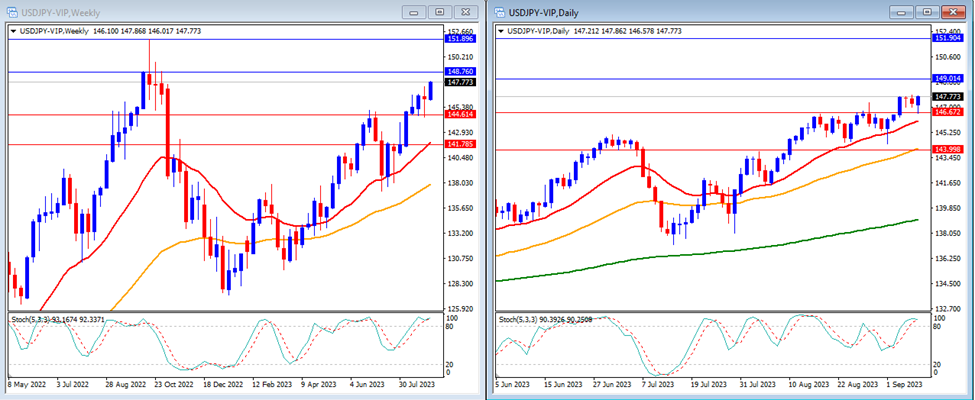
Last week, USDJPY moved higher and was able to reach our resistance level. USDJPY closed the week at 147.77.
On the weekly timeframe, it’s evident that the Stochastic Indicator is situated within the overbought area. Additionally, the price is still trading above the 20, 50, and 200-period moving averages.
Our weekly resistance levels are at 148.76 and 151.89, with support levels at 144.61 and 141.78.
On the daily timeframe, the stochastic indicator is currently higher within the overbought area. Additionally, the price is now trading above the 20, 50, and 200-period moving averages.
Our daily resistance levels are currently at 149.01 and 151.90, while the support levels are at 146.67 and 143.99.
Conclusion: Anticipating a week of high volatility for USDJPY, as the market awaits the release of inflation and retail sales data from the US. Additionally, the market remains watchful for any potential intervention by the Bank of Japan in the currency market. Our expectation is for the pair to move higher, with the possibility of reaching our resistance level at 148.76.
Make informed decisions with the most up-to-date and reliable financial data, exclusively provided by vtmarkets.com.