Spreads
Spreads
Spreads
Spreads
Spreads
Make informed decisions with the most up-to-date and reliable financial data, exclusively provided by vtmarkets.com.
EUR/USD Trends Lower Amid Economic Dynamics
The EUR/USD pair reached a new three-month low, hovering just above 1.0700, primarily due to robust US economic data and a prevailing sense of risk aversion bolstering the US Dollar. In contrast, Eurozone indicators painted a concerning picture, with a substantial 11.7% drop in German Factory Orders and a 0.2% decline in Eurozone Retail Sales for July, casting uncertainty over the European Central Bank’s (ECB) upcoming decisions. Despite these setbacks, the Euro managed to outperform the Pound and Swiss Franc. Upcoming Eurostat releases on Q2 employment and GDP data are not expected to have a significant impact since they involve revisions.
Conversely, in the US, the ISM Manufacturing PMI surpassed expectations, bolstering the Greenback. After briefly touching a low of 1.0702, the EUR/USD pair rebounded to 1.0730. The US Dollar’s strength continues to be driven by robust economic performance and risk aversion. Looking ahead, Jobless Claims and Unit Labor Cost data are anticipated on Thursday, likely to further influence the currency market.
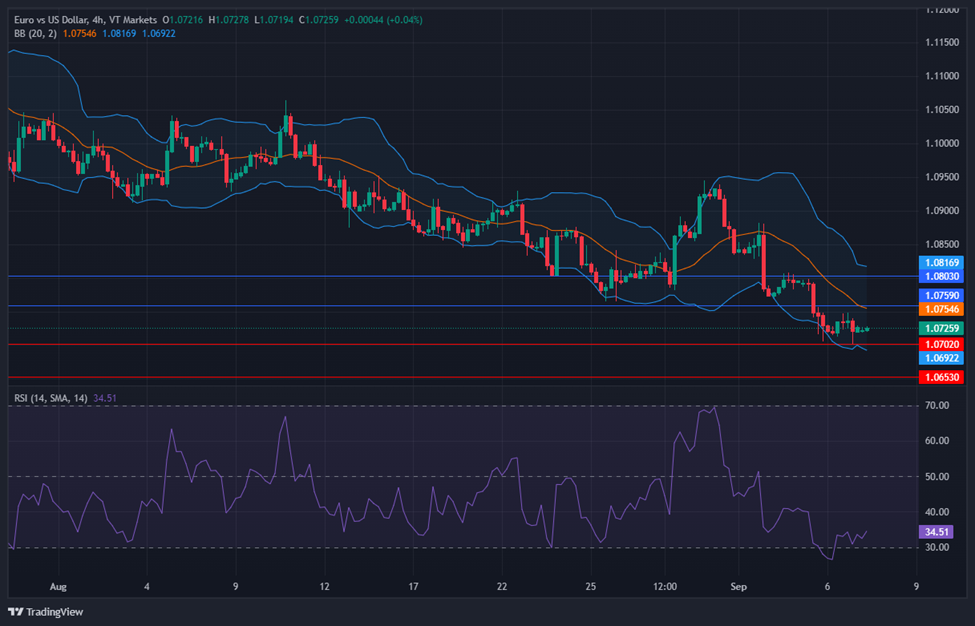
According to technical analysis, the EUR/USD moves flat on Wednesday and is currently trading just above the lower bands of the Bollinger Bands. This movement suggests the possibility of another downward move to create a lower push to the lower band. The Relative Strength Index (RSI) is currently at 34, indicating that the EUR/USD is trending lower and attempting to stay in a bearish trend.
Resistance: 1.0759, 1.0803
Support: 1.0702, 1.0653
XAU/USD Extends Decline Amid Dollar’s Ongoing Strength and Mixed Economic Data
On Wednesday, the US Dollar continued its ascent, causing XAU/USD (Gold) to decline for the fourth consecutive day. Gold traded near an intraday low of $1,915.27 per troy ounce, reacting to mixed US macroeconomic data.
S&P Global revised down the August Services PMI, indicating a slowdown in growth, while the ISM Services PMI reported expansion in the services sector. The IBD/TIPP Economic Optimism Index also rose, signaling resilience in the economy. However, inflation-related concerns persisted, leading to increased odds of a 25-basis points rate hike by the Federal Reserve in November, which in turn drove demand for the safe-haven US Dollar. As a result, stock markets turned negative amid these developments.
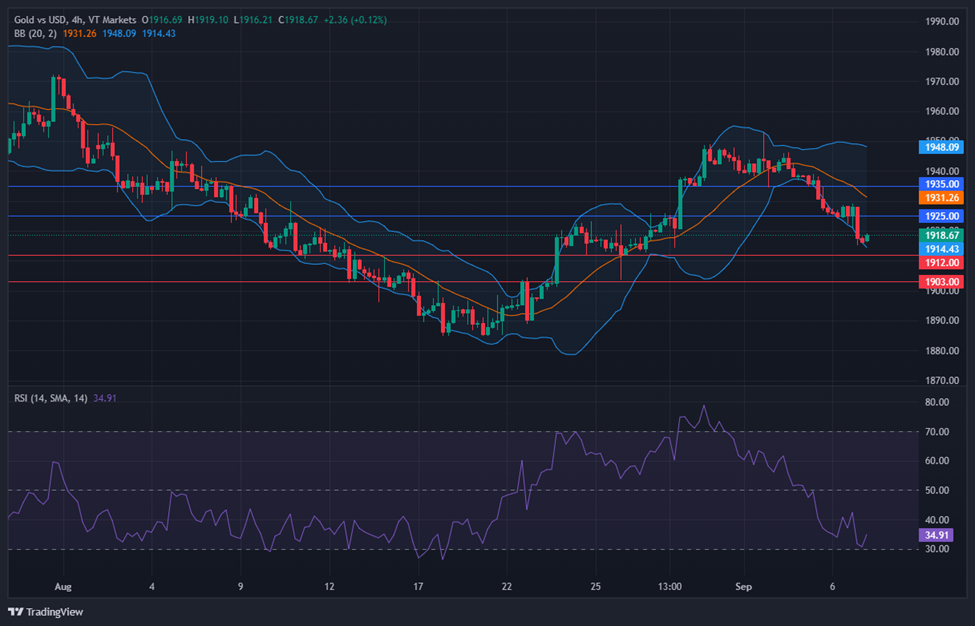
According to technical analysis, XAU/USD moves lower on Wednesday and created a push to the lower band of the Bollinger Bands. Currently, the price is moving slightly above the lower band, indicating a possibility of a slight increase in Gold’s value, but it’s still in a bearish mode. The Relative Strength Index (RSI) currently stands at 34, suggesting that the XAU/USD pair is now in a bearish mode.
Resistance: $1,925, $1,935
Support: $1,912, $1,903
Make informed decisions with the most up-to-date and reliable financial data, exclusively provided by vtmarkets.com.