Spreads
Spreads
Spreads
Spreads
Spreads
Gold (XAUUSD)
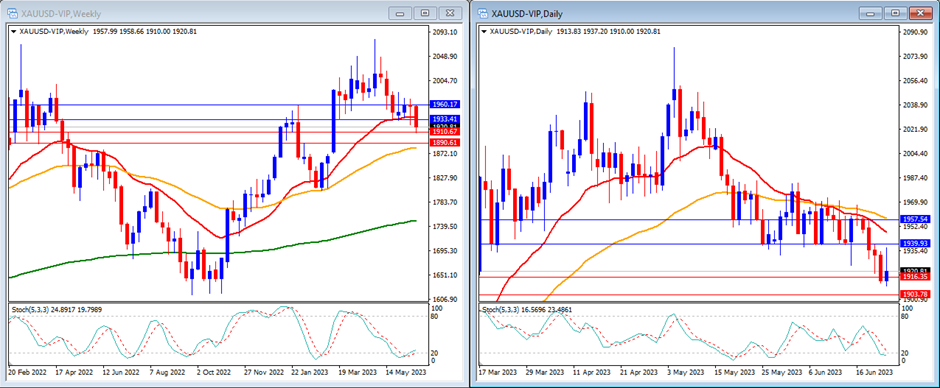
Last week, gold moved lower as expected and was able to break our support levels. The majority of the week saw weaker movement, with gold ultimately closing at $1,920.
On the weekly timeframe, we can see that the Stochastic Indicator is trying to exit the oversold area. This indicates that gold is starting to show signs of exhaustion. The gold price is now moving below the 20-period, but still above the 50, and 200-period moving averages.
Our weekly resistance levels are at $1,933 and $1,960, with support levels at $1,910 and $1,890.
On the daily timeframe, the Stochastic Indicator is moving lower trying to enter the oversold area. The price is currently below the 20 and 50-period moving averages, but still above the 200-period moving average.
Our daily resistance levels are at $1,939 and $1,957, with support levels at $1,916 and $1,903.
Conclusion: This week, gold could face a market sentiment similar to last week, given the lack of high-impact news events from the US. We expect another bearish week for gold, with a potential attempt to breach the support level at $1,910.
EURUSD
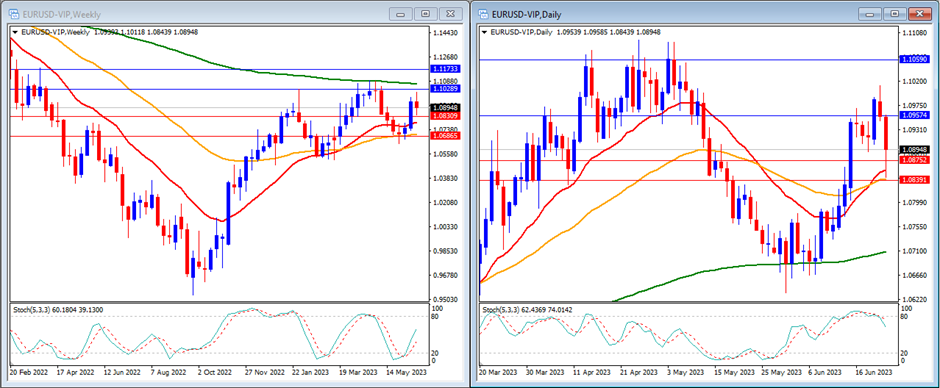
As predicted, EURUSD experienced an upward movement last week, nearly reaching the 1.1 level midway through the week. The currency pair closed the week at 1.0898.
On the weekly timeframe, the Stochastic Indicator is starting to move higher in the middle. The price is currently trading above the 20 and 50, but still below the 200-period moving averages.
Our weekly resistance levels are at 1.1028 and 1.1173, with support levels at 1.0830 and 1.0686.
On the daily timeframe, the Stochastic Indicator is moving lower, exiting the overbought area. The price is now moving above the 20, 50 and 200-period moving averages.
Our daily resistance levels are at 1.0957 and 1.1059, while the support levels are at 1.0875 and 1.0839.
Conclusion: This week, no major news events are anticipated from the EU, while the US is set to release PCE Core Prices data. Given the current market sentiment favouring the EUR, we expect that EURUSD will maintain its upward momentum and could possibly surpass the 1.1 level.
DJ30
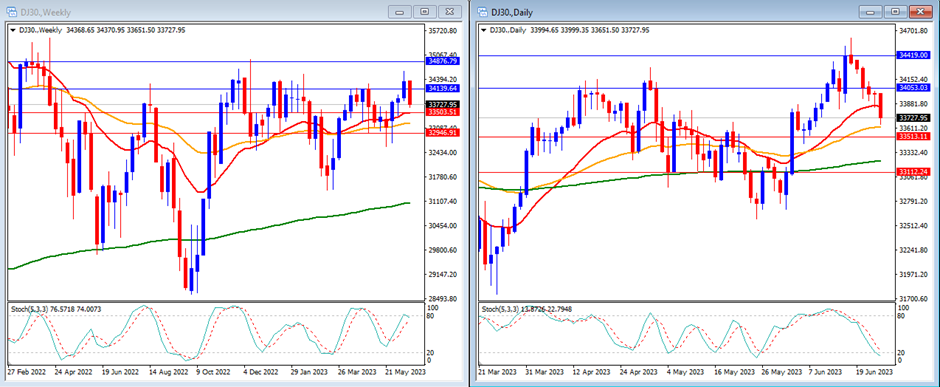
Throughout last week, the DJ30 experienced a weaker performance, influenced by the uncertainty present in the US market. As a result, the DJ30 closed the week at a lower point of 33,727.
On the weekly timeframe, we can see that the Stochastic Indicator is moving higher targeting the overbought area. The price is currently moving higher than the 20, 50 and 200-period moving average.
Our weekly resistance levels are at 34,139 and 34,876, with support levels at 33,503 and 32,946.
On the daily timeframe, we can see that the stochastic indicator is moving lower targeting the oversold area. The price is now moving below the 20-period, but still above the 50 and 200-period moving averages.
Our daily resistance levels are at 34,053 and 34,419, with support levels at 33,513 and 33,112.
Conclusion: This week, the US stock market may witness slower movement due to the absence of high-impact news from the US. Given the current negative sentiment, it is likely that the DJ30 will continue to decline, possibly dipping below our support level at 33,503.
USOUSD
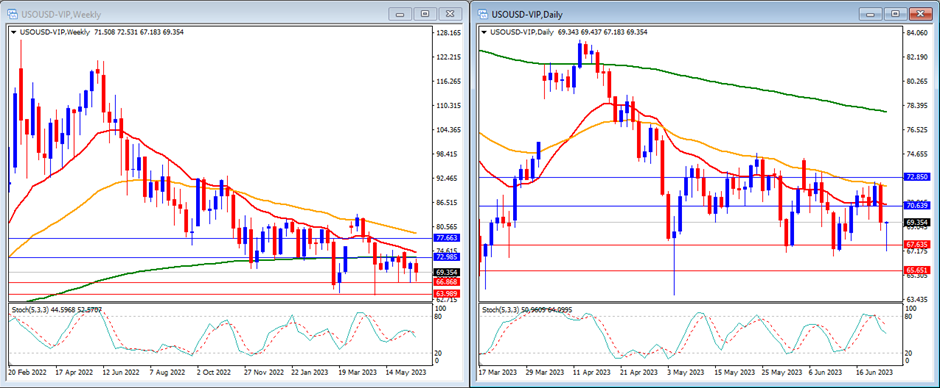
Last week, USOUSD (Oil) experienced a downward movement towards the end of the week, successfully reaching our support levels. The commodity closed the week at 69.35.
On the weekly timeframe, we can see that the Stochastic Indicator is moving in the middle with no clear direction. The price is currently moving below the 20, 50, and 200-period moving averages.
Our weekly resistance levels are at 72.98 and 77.66, with support levels at 66.86 and 63.98.
On the daily timeframe, the Stochastic Indicator is moving slightly lower in the middle after reaching the overbought area. The price is now moving below the 20, 50, and 200-period moving averages.
Our daily resistance levels are at 70.63 and 72.85, while support levels are at 67.63 and 65.65.
Conclusion: We can expect heightened volatility in USOUSD this week. A stronger upward movement may be observed, with the possibility of reaching our resistance level at 72.85.
NAS100
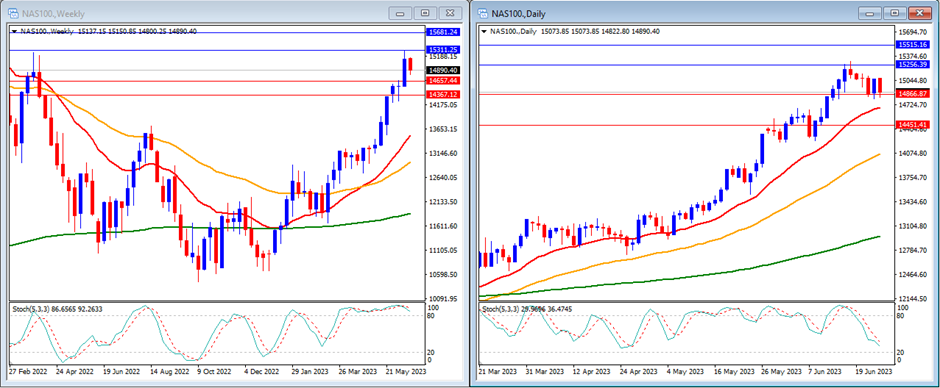
Last week, the NAS100 recorded its first lower week in the last six weeks, influenced by the uncertainty in the US market. The index closed the week at a lower point of 14,890.
On the weekly timeframe, we can see that the Stochastic Indicator is still within the overbought range. The price is currently still moving above the 20, 50, and 200-period moving averages.
Our weekly resistance levels are at 15,311 and 15,681, with support levels at 14,657 and 14,367.
On the daily timeframe, the stochastic indicator is moving lower targeting the oversold area. The price is still moving above the 20, 50, and 200-period moving averages.
Our daily resistance levels are currently at 15,256 and 15,515, while support levels are at 14,866 and 14,451.
Conclusion: This week, the US stock market might witness slower movement as a result of the absence of high-impact news from the US. Considering the current negative sentiment, it is likely that the NAS100 will continue to decline, possibly falling below our support level of 14,657.
GBPUSD
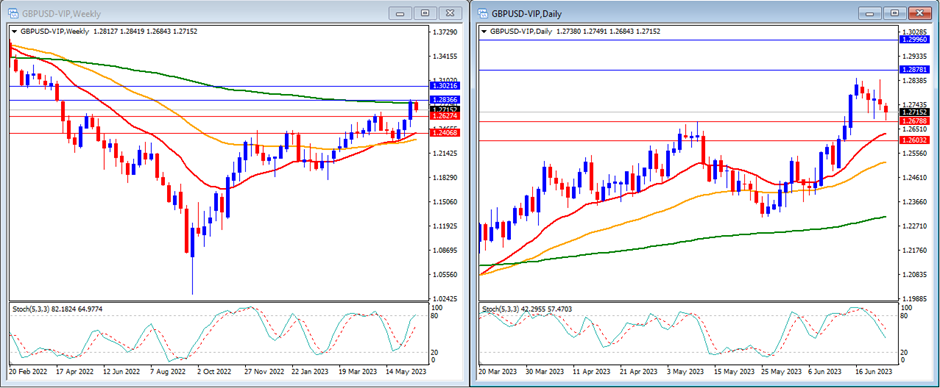
Last week, GBPUSD experienced a slower week with high volatility movement. The pair closed the week at 1.2715.
On the weekly timeframe, the Stochastic Indicator is moving higher in the middle targeting the overbought area. The price is currently moving above the 20 and 50-period moving averages, and just get rejected and is still below the 200-period moving average.
Our weekly resistance levels are at 1.2836 and 1.3021, while support levels are at 1.2627 and 1.2406.
On the daily timeframe, our stochastic indicator is moving strongly lower targeting the oversold area. The price is currently still moving above the 20, 50 and 200-period moving averages.
Our daily resistance levels are now at 1.2878 and 1.2996, while support levels are at 1.2678 and 1.2603.
Conclusion: This week, we can expect lower volatility in GBPUSD as there are no significant news events expected from the UK. However, we anticipate another upward movement in GBPUSD, with the potential to reach higher towards our resistance level at 1.2836.
USD Index
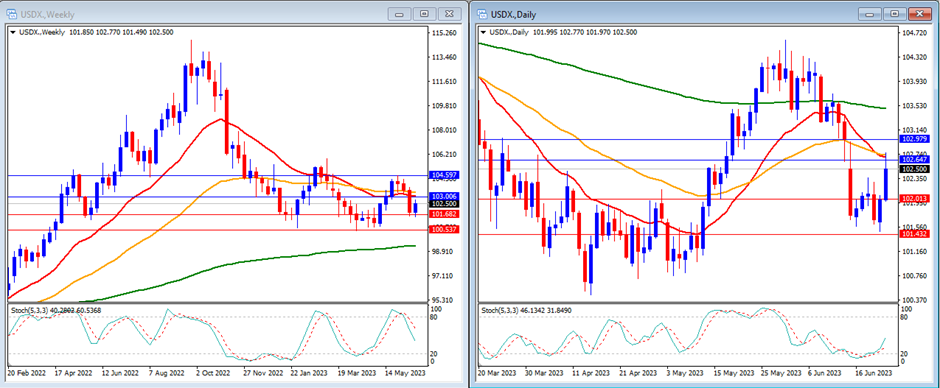
Last week, the USD Index experienced an upward movement, influenced by comments made by Fed Chair Jerome Powell. The index closed the week at 102.50.
On the weekly timeframe, we can see that the Stochastic Indicator is moving lower after exiting the overbought area. The price is below the 20 and 50, but still above the 200-period moving averages.
Our weekly resistance levels are at 103.00 and 104.59, with support levels at 101.68 and 100.53.
On the daily timeframe, the Stochastic Indicator is moving higher after exiting the overbought area. The price is still moving below the 20, 50 and 200-period moving averages.
Our daily resistance levels are at 102.64 and 102.97, with support levels at 102.01 and 101.43.
Conclusion: This week, we can expect slow movement in the USD Index due to the lack of significant news events from the US. However, we anticipate a potential upward movement in the USD Index, with the possibility of reaching our resistance levels at 102.64.
USDJPY
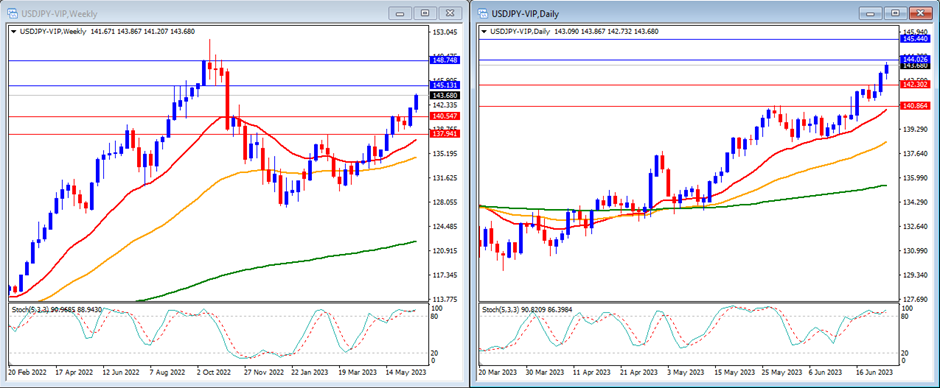
In the previous week, USDJPY experienced an upward movement, driven by the strong demand for the US Dollar. The currency pair closed the week at 143.68.
On the weekly timeframe, we can observe that the Stochastic Indicator is moving inside the overbought zone. The price is above the 20, 50, and 200-period moving averages.
Our weekly resistance levels are at 145.13 and 148.74, with support levels at 140.54 and 137.94.
On the daily timeframe, the stochastic indicator is moving inside the overbought zone. The price is still above the 20, 50, and 200-period moving averages.
Our daily resistance levels are currently at 144.02 and 145.44, while the support levels are at 142.30 and 140.86.
Conclusion: USDJPY is likely to exhibit low volatility this week due to the absence of major news events from both the US and Japan. Despite this, market sentiment continues to favour the USD. Consequently, we can expect USDJPY to trend higher, possibly surpassing our resistance level at 144.02.