Spreads
Spreads
Spreads
Spreads
Spreads
Gold (XAUUSD)
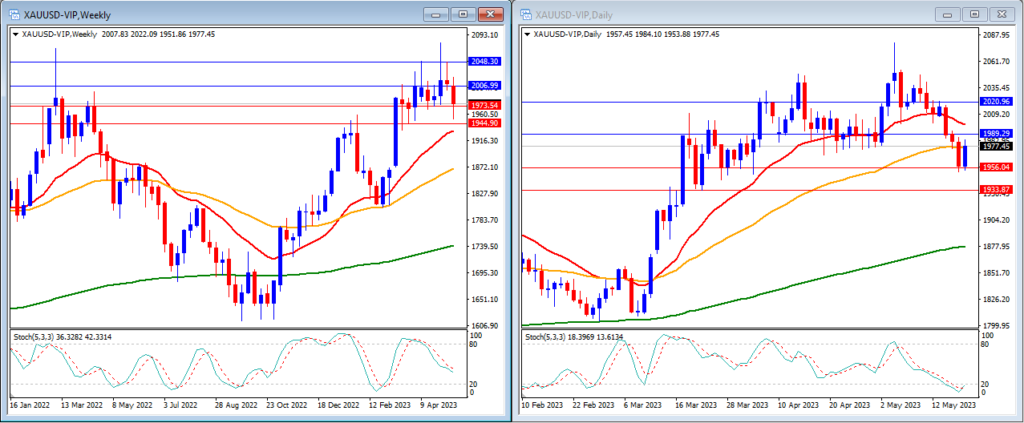
Last week, gold moved lower as expected and managed to break through the 1st daily and weekly support levels. Gold closed the week at $1,977.
On the weekly timeframe, we can see that the Stochastic Indicator is still moving lower in the middle, showing Gold still in a neutral trend. The gold price is still moving above the 20, 50, and 200-period moving averages.
Our weekly resistance levels are at $2,006 and $2,048 with the support levels at $1,973 and $1,944.
Meanwhile, on the daily timeframe, the Stochastic Indicator is moving lower inside the oversold level. The price is now moving below the 20, around the 50, and above the 200-period moving averages.
Our daily resistance levels are at $1,989 and $2,020, with the support levels at $1,956 and $1,933.
Conclusion: This week, the FOMC Meeting Minutes and Core PCE Price Index from the US will be the market movers. We anticipate gold might move marginally lower and touch our daily support level at $1,956 before going higher.
EURUSD
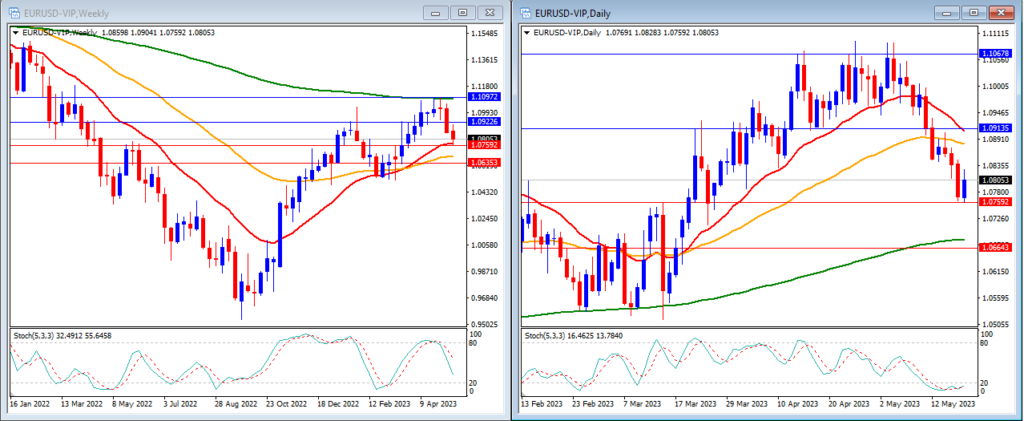
Last week, EURUSD continued its downward movement and managed to reach our support levels as expected. EURUSD closed the week at 1.0805.
On the weekly timeframe, the Stochastic Indicator is moving lower in the middle. The price is still trading below the 200-period moving average but above the 20 and 50-period moving averages.
Our weekly resistance levels are at 1.0922 and 1.1097, with support levels at 1.0759 and 1.0635.
On the daily timeframe, the Stochastic Indicator is moving inside the oversold level. The price is now moving below the 20 and 50, but still above the 200-period moving averages.
Our daily resistance levels are at 1.0913 and 1.1067, while the support levels are at 1.0759 and 1.0643.
Conclusion: This week, we will see the release of manufacturing and services PMI data in the EU and the US, which could impact the EURUSD. We anticipate that EURUSD might move marginally higher and attempt to reach the 1.09 level.
DJ30
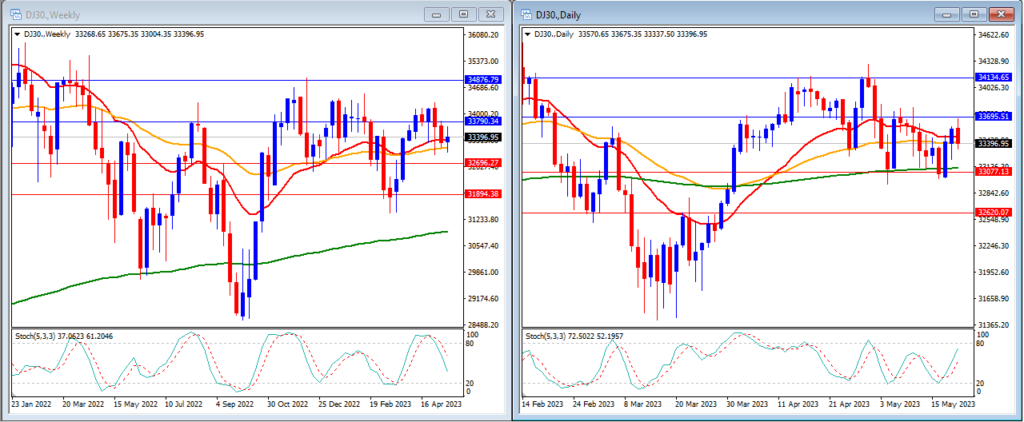
Last week, the DJ30 was in consolidation mode and remained between our support and resistance levels. The DJ30 closed the week lower at 33,396.
On the weekly timeframe, we can see that the Stochastic Indicator is moving lower in the middle. The price is now moving around the 20 and 50, but still above the 200-period moving averages.
Our weekly resistance levels are at 33790 and 34876, with support levels at 32696 and 31894.
In the daily timeframe, we can see that the stochastic indicator is moving higher in the middle. The price is moving around the 20 and 50, but still above the 200-period moving averages.
Our daily resistance levels are at 33695 and 34134, with support levels at 33077 and 32620.
Conclusion: As the US debt ceiling discussion continues, we can anticipate some sudden volatility in the US stock market. We expect that the DJ30 will move lower and reach our support level of 33,077.
USOUSD
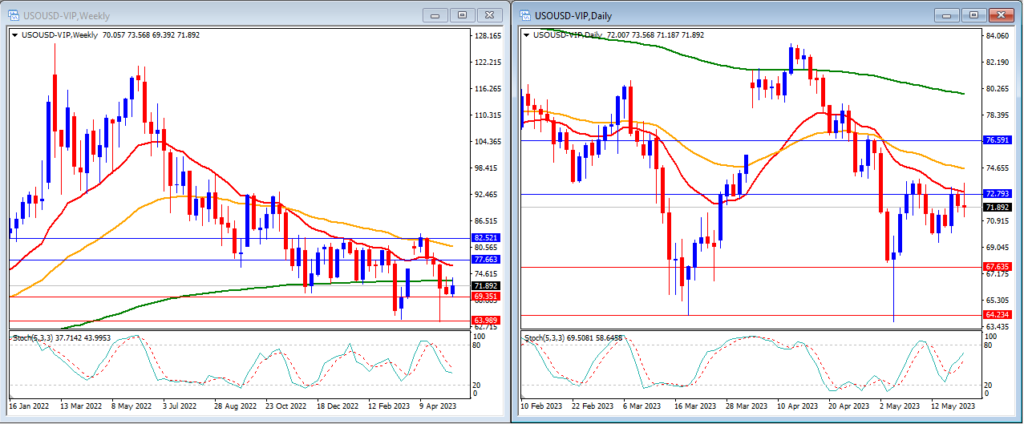
Last week, USOUSD (Oil) moved slowly but slightly higher, while remaining between our support and resistance levels. USOUSD closed the week at 71.89.
On the weekly timeframe, the Stochastic Indicator is moving lower in the middle. The price is now moving below the 20, 50 and 200-period moving averages.
Our weekly resistance levels are at 77.66 and 82.52, with support levels at 69.35 and 63.98.
On the daily timeframe, the Stochastic Indicator is moving higher in the middle. Price is now moving below the 20, 50 and 200-period moving averages.
Our daily resistance levels are at 72.79 and 76.59, while support levels are at 67.63 and 64.23.
Conclusion: Oil experienced its first week of gains as the market remained focused on the US debt ceiling discussion. For this week, we may see some slightly higher movement, aiming to surpass our daily resistance level at 72.79.
NAS100
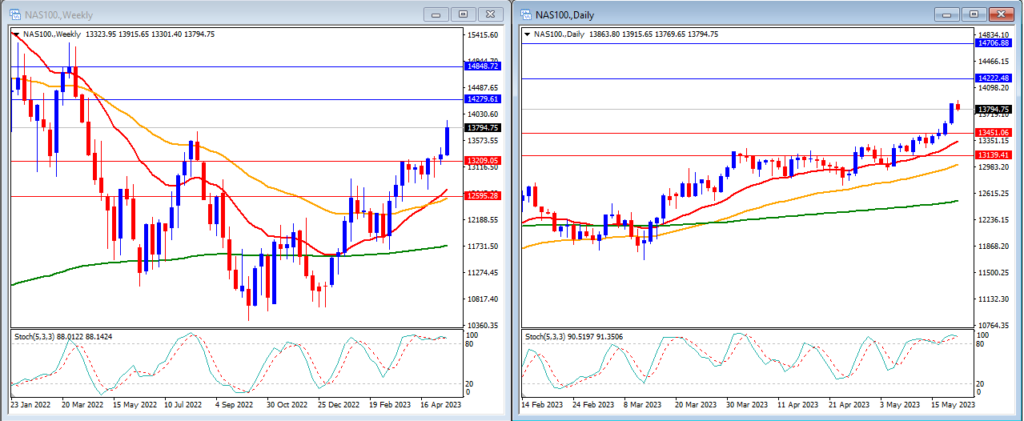
The NAS100 rose last week and managed to break through our resistance levels. The NAS100 closed the week at 13,794.
On the weekly timeframe, we can see that the Stochastic Indicator is still moving inside the overbought level. The price is now moving above the 20, 50 and 200-period moving averages.
Our weekly resistance levels are 14279 and 14848, with support levels at 13209 and 12595.
In the daily timeframe, we can see that the stochastic indicator is moving inside the overbought level. The price is moving above the 20, 50 and 200-period moving averages.
Our daily resistance levels are currently at 14222 and 14706, while support levels are at 13451 and 13139.
Conclusion: As the US debt ceiling discussion continues, we can anticipate some sudden volatility in the US stock market. We expect that the NAS100 will move lower and return to our daily support level at 13,451.
GBPUSD
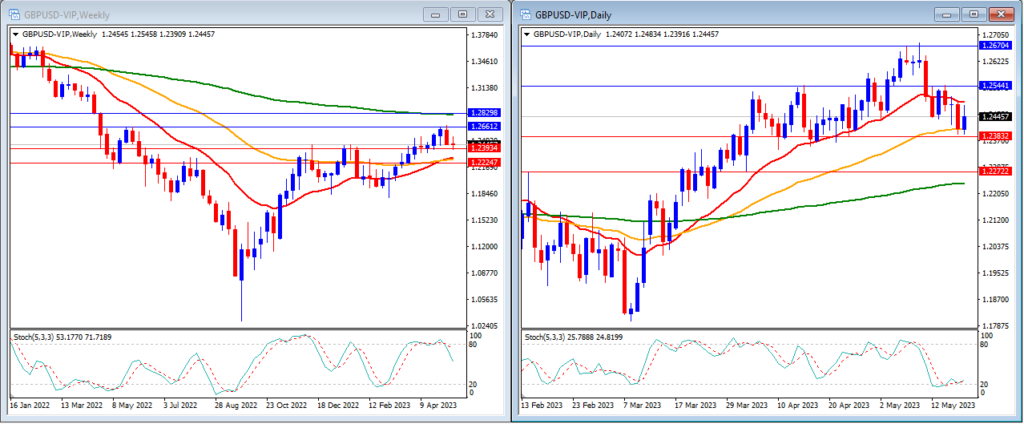
Last week, GBPUSD moved flat and remained between our support and resistance levels. GBPUSD closed the week at 1.2445.
On the weekly timeframe, the Stochastic Indicator is exiting the overbought level. The price is moving above 20 and 50-period moving averages and below the 200-period moving average.
Our weekly resistance levels are at 1.2661 and 1.2829, while support levels are at 1.2393 and 1.2224.
On the daily timeframe, our stochastic indicator is moving just above the oversold level. The price is now moving below the 20, but still above the 50 and 200-period moving averages.
Our daily resistance levels are now at 1.2544 and 1.2670, while support levels are at 1.2383 and 1.2272.
Conclusion: This week, we will have the UK Services and Manufacturing PMI, which may affect the GBPUSD. We expect that the pair will move slightly higher and reach our resistance levels at 1.2544.
USD Index
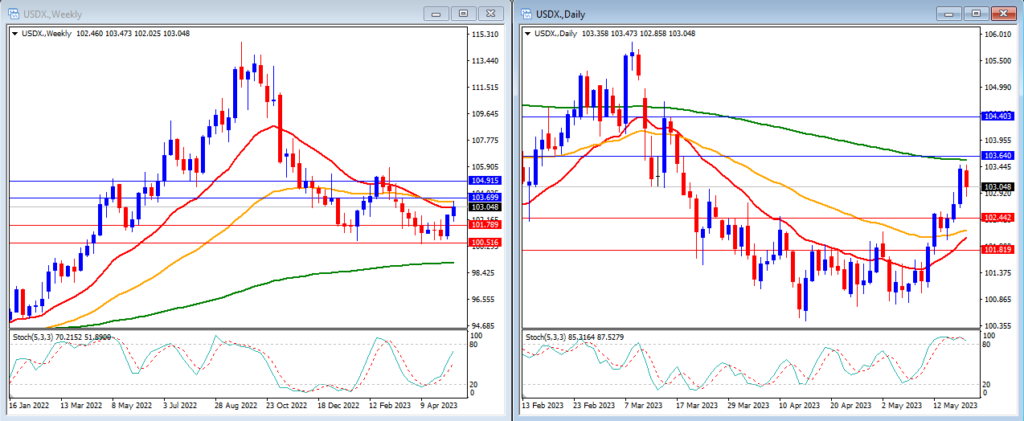
Last week, the USD Index received a boost and managed to break our resistance level as anticipated. The USD Index closed the week higher at 103.04.
On the weekly timeframe, we can see that the Stochastic Indicator is moving higher in the middle. Price is still moving around the 20 and 50-period moving averages but still above the 200-period moving average.
Our weekly resistance levels are 103.69 and 104.15 with the support levels at 101.78 and 100.51.
On the daily timeframe, the Stochastic Indicator is moving inside the overbought level. Price is now moving above the 20 and 50, but still below the 200-period moving averages.
Our daily resistance levels are 103.64 and 104.40 with the support levels at 102.44 and 101.81.
Conclusion: This week, we can expect slightly higher volatility in the USDX, as the US will have Flash Services and Manufacturing PMI and Core PCE Price Index as high-impact data. Additionally, the discussion regarding the US debt ceiling will remain a focus for the market. We anticipate that the USD Index might climb even higher and reach our resistance level of 103.69.
USDJPY
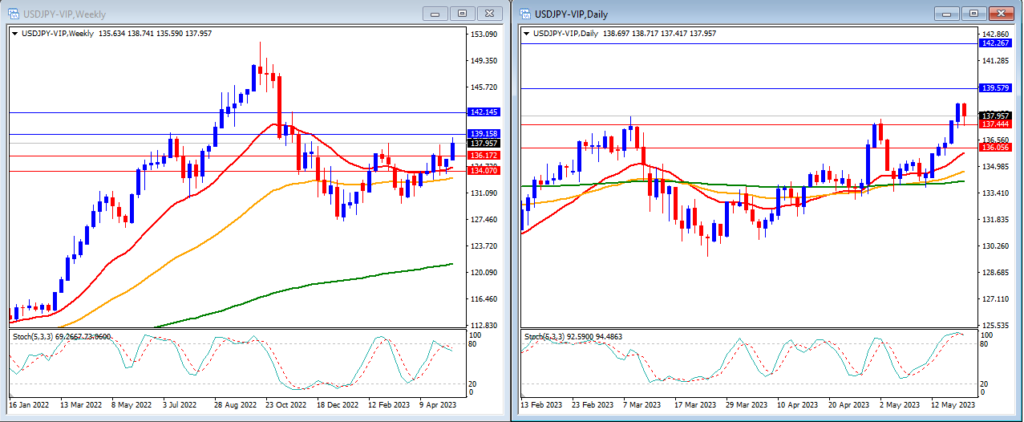
Last week, USDJPY managed to move higher as the US Dollar strengthened and the Japanese Yen remained under pressure. The pair was able to break our resistance level as expected. USDJPY closed the week at 137.95.
On the weekly timeframe, we can see that the Stochastic Indicator is moving just below the overbought level. The price is moving above the 20, 50 and 200-period moving average.
Our weekly resistance levels are at 139.15 and 142.14, with the support levels at 136.17 and 134.07.
On the daily timeframe, the stochastic indicator is moving inside the overbought level. Price is moving above the 20, 50 and at 200-period moving averages.
Our daily resistance levels are now at 139.57 and 142.26, while the support levels are at 137.44 and 136.05.
Conclusion: This week, we expect USDJPY to be influenced mainly by US Dollar events, as there are no high-impact news releases from Japan. We anticipate USDJPY to continue moving higher and reach our next resistance level at 139.15.