Spreads
Spreads
Spreads
Spreads
Spreads
Make informed decisions with the most up-to-date and reliable financial data, exclusively provided by vtmarkets.com.
EUR/USD Reaches Two-Week High Amid Dovish Fed Signals and ECB Easing Prospects
The EUR/USD pair witnessed a notable uptrend, reaching new two-week highs in the 1.0865–1.0870 range, buoyed by the ongoing weakness of the US dollar as the USD Index dipped below the 104.00 mark, despite positive shifts in US yields. This movement was supported by risk-on market sentiment and anticipations of a Federal Reserve easing cycle starting in June, reinforced by comments from Fed officials suggesting a possible reduction in policy rates over the summer. Contrasting views among Fed policymakers highlighted a debate on the timing and conditions for rate cuts. Concurrently, the European Central Bank (ECB) signaled a potential start for its easing cycle in the summer, with inflation data supporting such a move. This comes as 10-year bund yields in Europe showed a declining trend, indicating a complex interplay of expectations and market reactions affecting the EUR/USD dynamics.
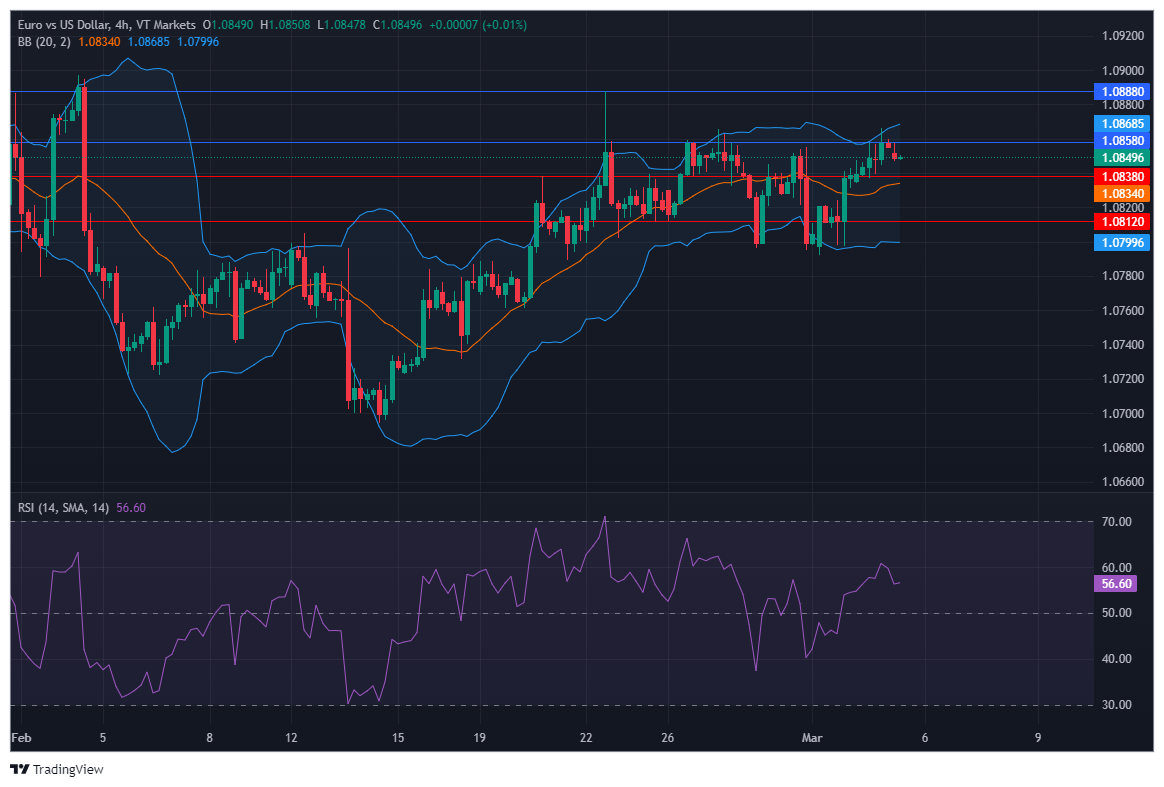
On Monday, the EUR/USD moved higher and was able to reach the upper band of the Bollinger Bands. Currently, the price is moving below the upper band, suggesting a potential downward movement to reach the middle band. Notably, the Relative Strength Index (RSI) maintains its position at 56, signaling a neutral outlook for this currency pair.
Resistance: 1.0858, 1.0888
Support: 1.0838, 1.0812
XAU/USD Surges Past $2,100 Amid Economic Indicators and Federal Reserve Speculations
Spot Gold exceeded the $2,100 threshold on Monday, continuing its upward trajectory from Friday, albeit at a diminished pace, with a notable $55.00 increase on the last trading day of the prior week, marking its most significant daily gain since December. The ascent began on Thursday following the release of US inflation data, which aligned with expectations and showed a slower annual increase in the Fed’s preferred inflation metric, the January Core PCE Price Index, since March 2021. This was seen as a relief after earlier CPI figures had heightened inflationary pressure concerns. The momentum was sustained into Friday, driven by disappointing US ISM Manufacturing PMI data and a decline in Treasury yields, which pressured the US Dollar further. Despite a minor recovery in yields at the start of the new week, gold’s trajectory remained unaffected, with market participants eyeing the Federal Reserve’s next meeting for potential rate cut signals, not anticipated before June.
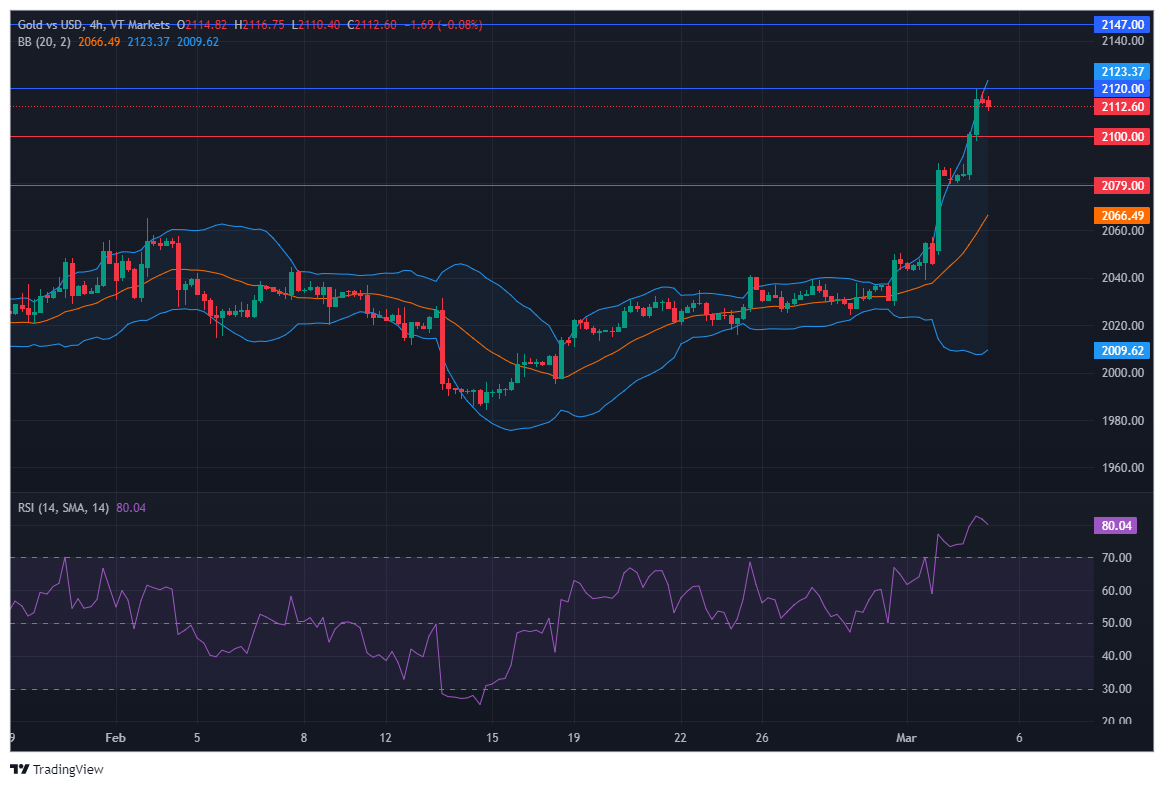
On Monday, XAU/USD moved higher to reach the upper band of the Bollinger Bands. Currently, the price is moving just below the upper band, suggesting a potential higher movement to reach above the upper band and reach the resistance level. The Relative Strength Index (RSI) stands at 80, signaling a strong bullish outlook for this pair.
Resistance: $2,120, $2,147
Support: $2,100, $2,079
Make informed decisions with the most up-to-date and reliable financial data, exclusively provided by vtmarkets.com.