Spreads
Spreads
Spreads
Spreads
Spreads
Make informed decisions with the most up-to-date and reliable financial data, exclusively provided by vtmarkets.com.
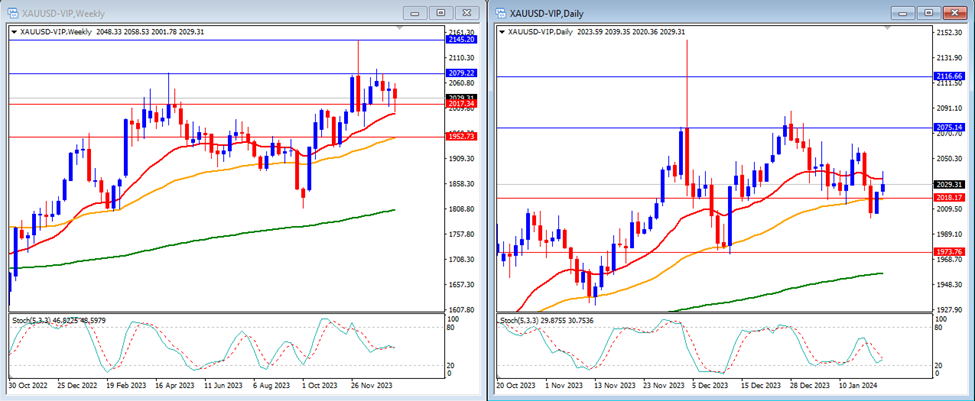
Last week, gold prices fell slightly and closed the week at $2,029.
On the weekly timeframe, the Stochastic Indicator suggests a consolidating movement in the middle. Currently, gold is trading above the 20, 50, and 200-week moving averages.
Weekly resistance levels: $2,079 and $2,145.
Weekly support Levels: $2,017 and $1,952.
On the daily timeframe, the Stochastic Indicator moves lower near the oversold area. Gold’s price currently stands below the 20-day but remains below the 50 and 200-day moving averages.
Daily resistance levels: $2,075 and $2,116.
Daily support levels: $2,018 and $1,973.
Conclusion: This week, we anticipate moderate volatility due to a few high-impact data releases from the US such as advance GDP and PCE price index together with the PMI data, which may directly affect the gold price. Our analysts predict a potential upward trend for Gold this week, potentially leading it to reach our resistance level at $2,075.
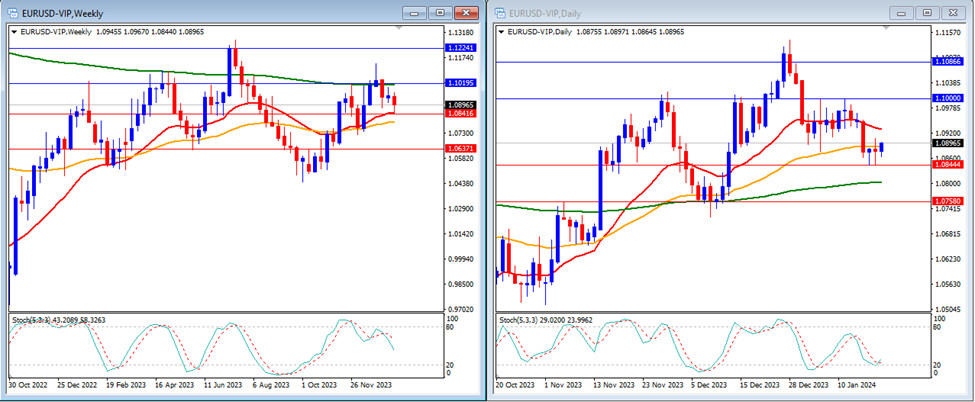
Last week, EUR/USD prices fell slightly and closed the week at 1.0896.
On the weekly timeframe, the Stochastic Indicator is moving lower below the overbought area. Currently, the price trades above the 20 and 50-week moving averages but below the 200-week moving average.
Weekly resistance levels: 1.1019 and 1.1224.
Weekly support Levels: 1.0841 and 1.0637.
On the daily timeframe, the Stochastic Indicator moves lower near the oversold area. Currently, the EUR/USD price stands below the 20-day moving average but remains above the 50 and 200-day moving averages.
Daily resistance levels: 1.1000 and 1.1086.
Daily support levels: 1.0844 and 1.0758.
Conclusion: This week, we anticipate high volatility due to a few high-impact data releases from the Eurozone with ECB rate statements and PMI data. Our analysts predict a potential downward trend for the EUR/USD this week, potentially leading it to reach our support level at 1.0844.
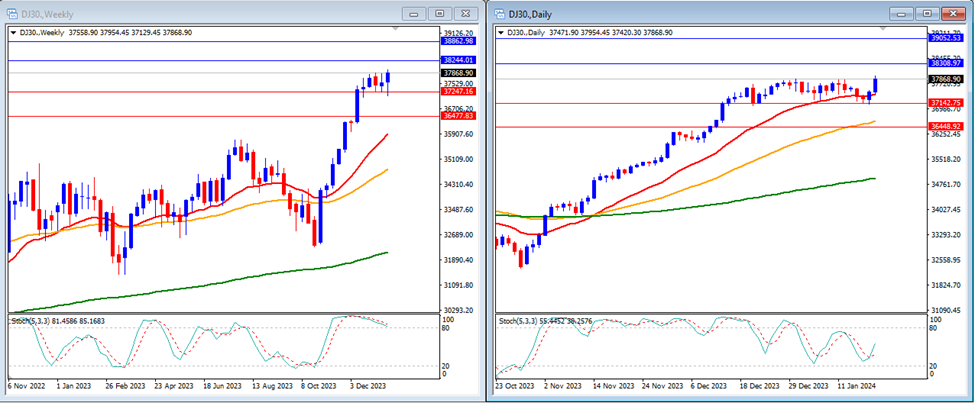
Last week, DJ30 prices rose slightly and closed the week at 37,868.
On the weekly timeframe, the Stochastic Indicator consolidated within the overbought area. Currently, the indices trade above the 20, 50, and 200-week moving averages.
Weekly resistance levels: 38,244 and 38,862.
Weekly support Levels: 37,247 and 36,477.
On the daily timeframe, the Stochastic Indicator moves higher targeting just above the oversold area. Currently, the price is still moving above the 20, 50, and 200-day moving averages.
Daily resistance levels: 38,308 and 39,052.
Daily support levels: 37,142 and 36,448.
Conclusion: This week, we anticipate moderate volatility due to a few high-impact data releases from the US such as advance GDP and PCE price index together with the PMI data. Our analysts predict a potential upward trend for the DJ30, possibly reaching our resistance level at 38.308.
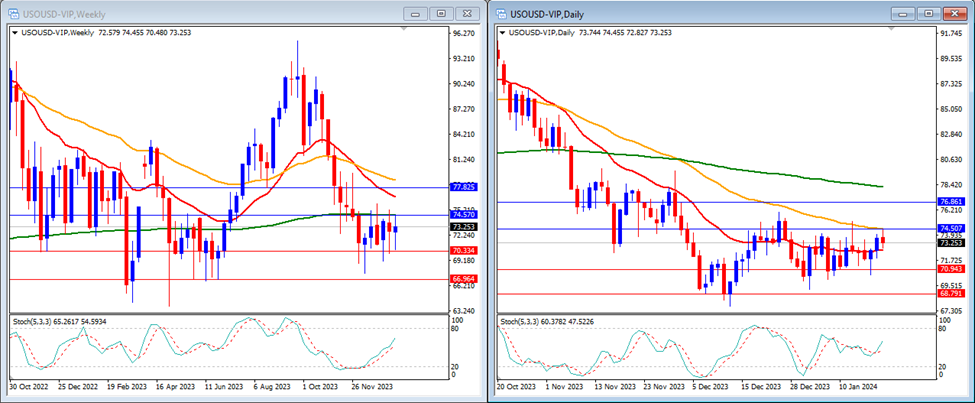
Last week, USO/USD prices rose slightly and closed the week at 73.25.
On the weekly timeframe, the Stochastic Indicator indicates an upward movement in the middle. The price remains below the 20, 50, and 200-week moving averages.
Weekly resistance levels: 74.57 and 77.82.
Weekly support Levels: 70.33 and 66.96.
On the daily timeframe, the Stochastic Indicator is moving higher in the middle and the price is currently moving above the 20-day moving average, but still below the 50 and 200-day moving averages.
Daily resistance levels: 74.50 and 76.86.
Daily support levels: 70.94 and 68.79.
Conclusion: This week, we anticipate moderate volatility due to a few high-impact data releases from the US such as advance GDP and PCE price index together with the PMI data. However, we must also remain vigilant for any updates regarding tensions in the Middle East. Our analysts foresee potential upward momentum for USO/USD this week, possibly driving it toward our next resistance level at 74.57.
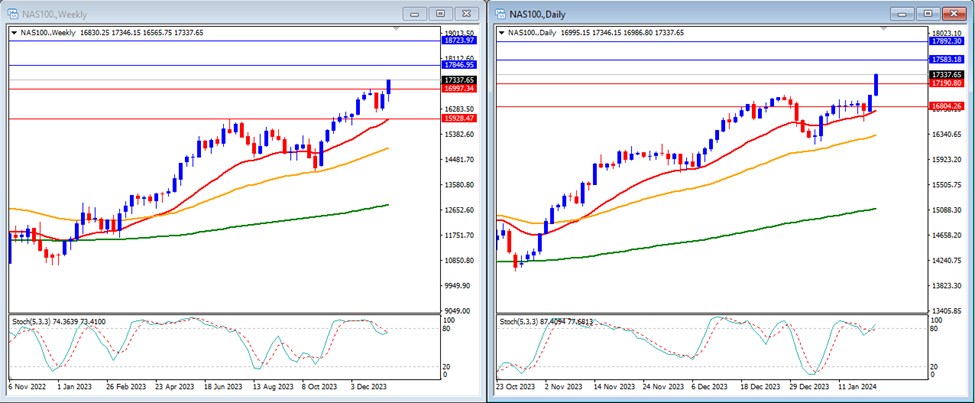
Last week, NAS100 prices rose strongly and closed the week at 17,337.
On the weekly timeframe, the Stochastic Indicator is trying to cross back higher just below the overbought area, while the price continues to trade above the 20, 50, and 200-week moving averages.
Weekly resistance levels: 17,846 and 18,723.
Weekly support Levels: 16,997 and 15,928.
On the daily timeframe, the Stochastic Indicator is crossing back higher, entering the overbought area. Currently, the price moves above the 20, 50, and 200-day moving averages.
Daily resistance levels: 17,583 and 17,892.
Daily support levels: 17,190 and 16,804.
Conclusion: This week, we anticipate moderate volatility due to a few high-impact data releases from the US such as advance GDP and PCE price index together with the PMI data. Our analysts predict a potential upward trend for the NAS100, possibly reaching our resistance level at 17,583.
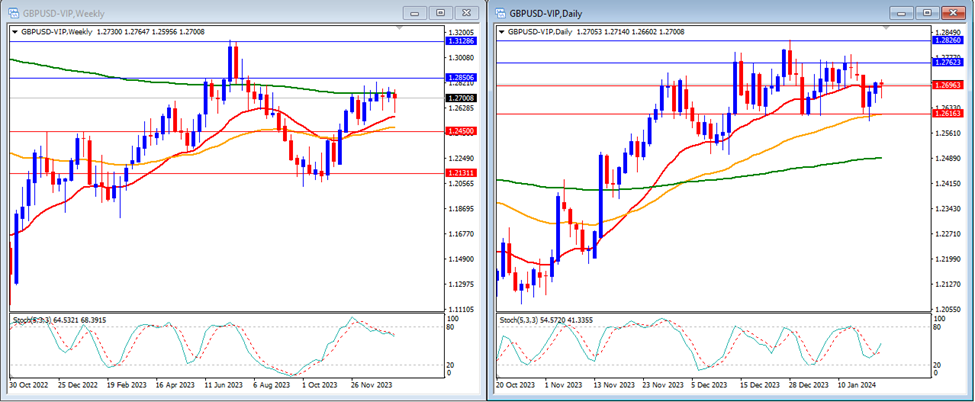
Last week, GBP/USD prices fell slightly and closed the week at 1.2700.
On the weekly timeframe, the Stochastic Indicator moves lower after exiting the overbought area. The price is trading above the 20 and 50-week moving averages and around the 200-week moving average.
Weekly resistance levels: 1.2850 and 1.3128.
Weekly support Levels: 1.2450 and 1.2131.
On the daily timeframe, our Stochastic Indicator moves higher in the middle. Currently, the price is trading above the 20, 50, and 200-day moving averages.
Daily resistance levels: 1.2762 and 1.2826.
Daily support levels: 1.2696 and 1.2616.
Conclusion: This week, we anticipate moderate volatility due to a few high-impact data releases from the US such as advance GDP and PCE price index together with the PMI data. Our analysts foresee a potential upward trend for the GBP/USD, potentially reaching our resistance level at 1.2850.
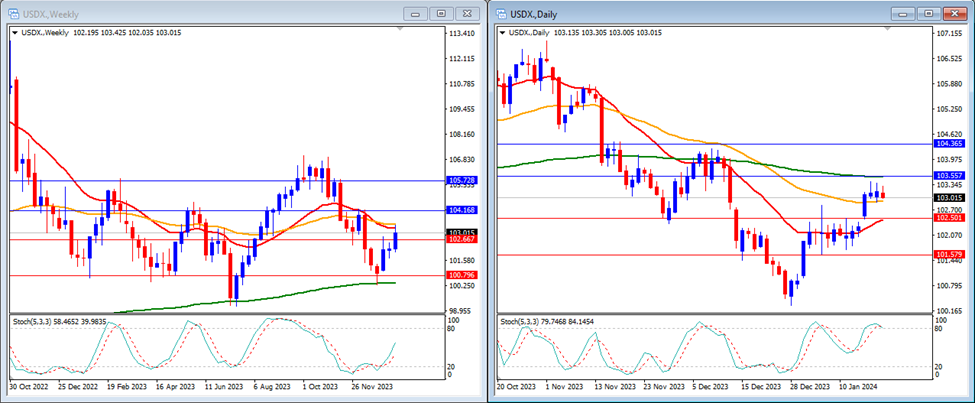
Last week, USDX prices rose strongly and closed the week at 103.01.
On the weekly timeframe, the Stochastic Indicator is moving higher in the middle. Currently, the price is trading below the 20 and 50-week moving averages but remains above the 200-week moving average.
Weekly resistance levels: 104.16 and 105.72.
Weekly support Levels: 102.66 and 100.79.
On the daily timeframe, the Stochastic Indicator is moving higher, entering the overbought area. The price is currently trading above the 20 and 50-day moving averages but remains below the 200-day moving averages.
Daily resistance levels: 103.55 and 104.36.
Daily support levels: 102.50 and 101.57.
Conclusion: This week, we anticipate moderate volatility due to a few high-impact data releases from the US such as advance GDP and PCE price index together with the PMI data. Our analysts foresee a potential upward trend for the USD Index, potentially reaching our resistance level at 103.55.
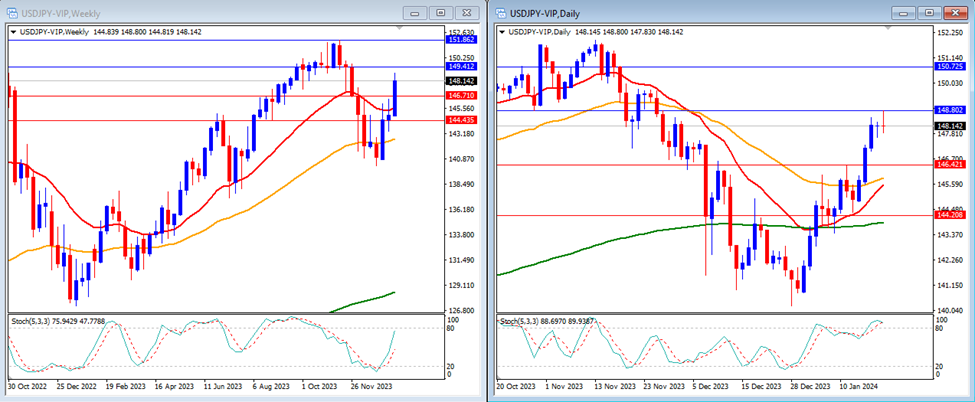
Last week, USD/JPY prices rose strongly and closed the week at 148.14.
On the weekly timeframe, the Stochastic Indicator moves higher targeting the overbought area. The price is currently trading above the 20, 50, and 200-week moving averages.
Weekly resistance levels: 149.41 and 151.86.
Weekly support Levels: 146.71 and 144.43.
On the daily timeframe, the Stochastic Indicator moves inside the overbought area. Currently, the price is moving above the 20, 50, and 200-day moving averages.
Daily resistance levels: 148.80 and 150.72.
Daily support levels: 146.42 and 144.20.
Conclusion: This week, we anticipate high volatility due to high-impact data releases from the Eurozone as the BOJ will release its monetary policy and rate statement. Our analysts foresee a potential upward trend for the USD/JPY, potentially reaching our resistance level at 149.41.
Make informed decisions with the most up-to-date and reliable financial data, exclusively provided by vtmarkets.com.