Spreads
Spreads
Spreads
Spreads
Spreads
Make informed decisions with the most up-to-date and reliable financial data, exclusively provided by vtmarkets.com.
Gold (XAUUSD)
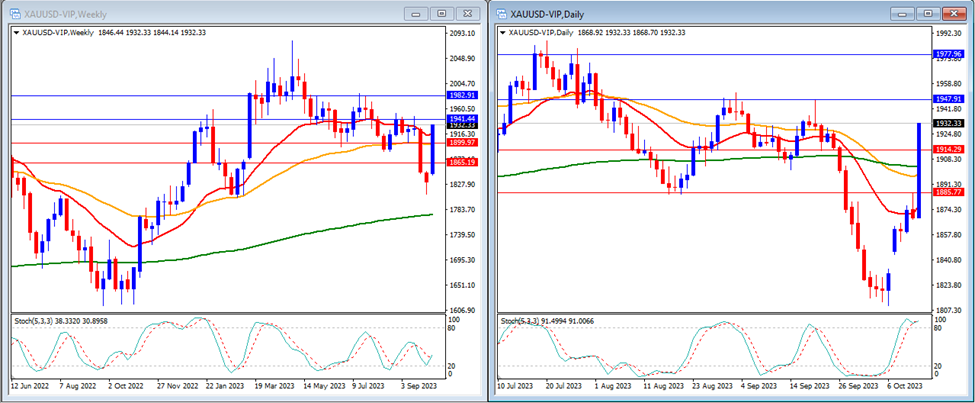
Last week, gold soared and broke above our resistance levels. Gold closed the week at $1,932.
On the weekly timeframe, we can observe that the Stochastic Indicator is situated in the middle. The gold price is trading above the 20-period, 50-period, and 200-period moving averages.
Our weekly resistance levels are at $1,941 and $1,982, with support levels at $1,899 and $1,865.
On the daily timeframe, the Stochastic Indicator is within the overbought area, while the price is presently trading above the 20-period, 50-period, and 200-period moving averages.
Our daily resistance levels are at $1,947 and $1,977, with support levels at $1,914 and $1,885.
Conclusion: This week, our focus will be on the escalating tension in the Middle East, which is anticipated to exert a significant influence on the Gold market, owing to its role as a safe haven asset. Furthermore, there will be a significant release of high-impact data in the form of US retail sales figures. We anticipate a positive sentiment for gold this week, with expectations of it moving higher, as we aim to reach our resistance level at $1,947.
EURUSD
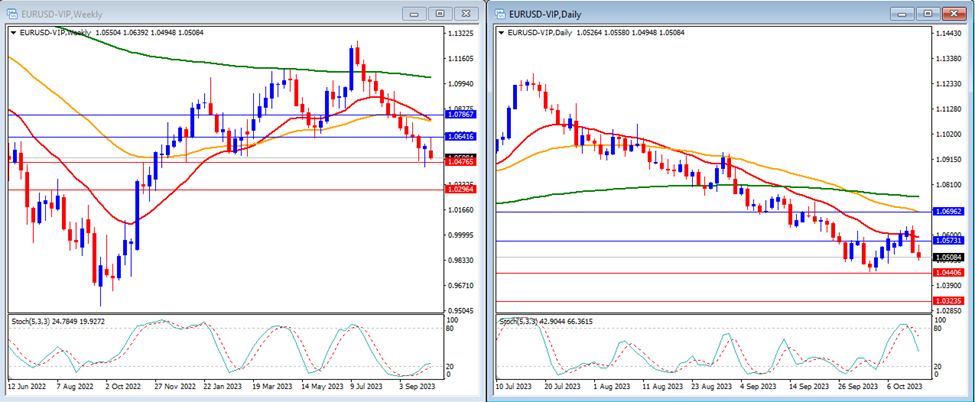
Last week, EURUSD moved lower and breached our support levels. EURUSD closed the week at 1.0508.
On the weekly timeframe, the Stochastic Indicator is situated in the oversold area, indicating potential buying opportunities. The price is currently trading below the 20-period, 50-period, and 200-period moving averages, underscoring the bearish trend.
Our weekly resistance levels are at 1.0641 and 1.0786, with support levels at 1.0476 and 1.0296.
On the daily timeframe, the Stochastic Indicator is moving lower after having exited the overbought area, while the price is trading below the 20-period, 50-period, and 200-period moving averages.
Our daily resistance levels are at 1.0573 and 1.0696, while the support levels are at 1.0440 and 1.0323.
Conclusion: We anticipate a week of high volatility for EURUSD as the market remains watchful for updates regarding the Middle East war situation. Our expectation is that EURUSD will experience a modestly downward movement and potentially reach our support level at 1.0440.
DJ30
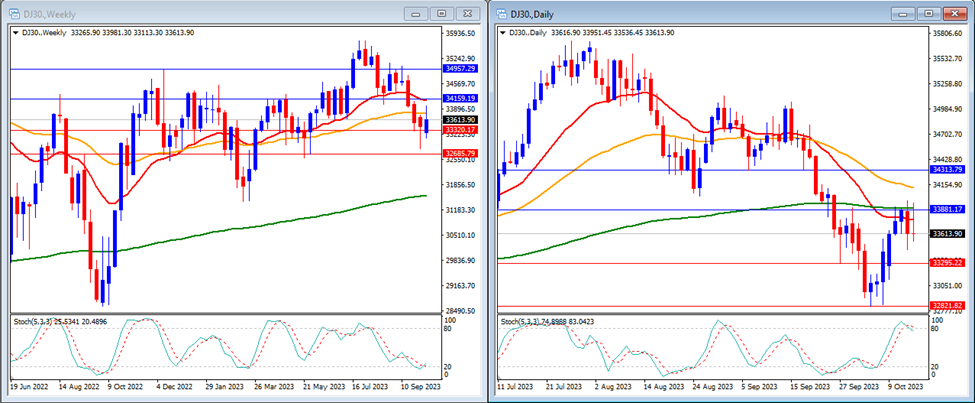
Last week, the DJ30 moved higher after reaching our support level, ultimately closing the week at 33,613.
On the weekly timeframe, it is noticeable that the Stochastic Indicator is in a downward trajectory, heading toward the oversold area. The price is presently below the 20-period and 50-period moving averages, but it remains above the 200-period moving average.
Our weekly resistance levels are at 34,159 and 34,957, with support levels at 33,320 and 32,685.
On the daily timeframe, the Stochastic Indicator is hovering on the edge of the oversold area. The price is currently trading below the 20-period, 50-period, and 200-period moving averages.
Our daily resistance levels are 33,881 and 34,313, with support levels at 33,295 and 32,821.
Conclusion: The US stock market is anticipated to undergo a week of heightened volatility, primarily driven by the release of US retail sales data, which is considered a significant market mover. We expect that the DJ30 may trend downward as market participants continue to assess the safe-haven status of the US Dollar, with a potential target at our support level of 33,295.
USOUSD
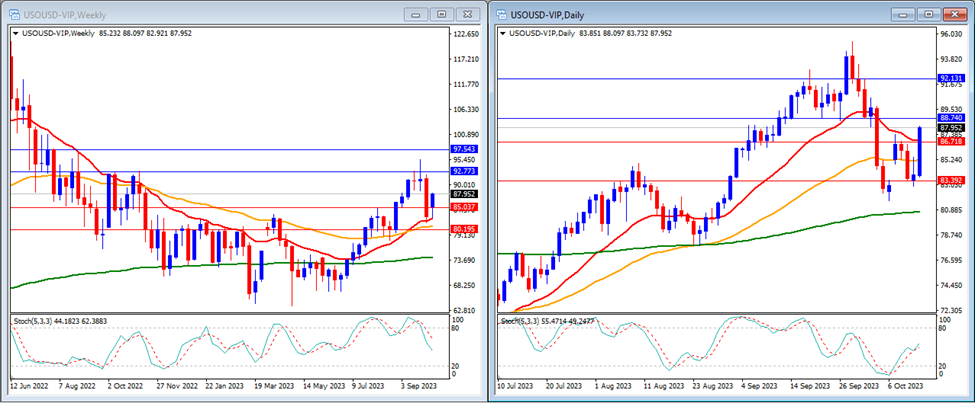
Last week, USOUSD (Oil) experienced an upward movement and successfully breached our resistance levels, ultimately closing the week at 87.95.
On the weekly timeframe, the Stochastic Indicator is currently trending lower after exiting the overbought area. Additionally, the price is trading above the 20-period, 50-period, and 200-period moving averages, indicating a generally bullish trend in the oil market.
Our weekly resistance levels are 92.77 and 97.54, with support levels at 85.03 and 80.19.
On the daily timeframe, the Stochastic Indicator is trending higher in the middle. The price is currently trading above the 20-period, 50-period, and 200-period moving averages
Our daily resistance levels are at 88.74 and 92.13, while support levels are at 86.71 and 83.39.
Conclusion: We anticipate another significant movement in USOUSD based on the latest sentiment surrounding it. There is a possibility of another upward movement, with USOUSD potentially reaching our resistance level at 88.74.
NAS100
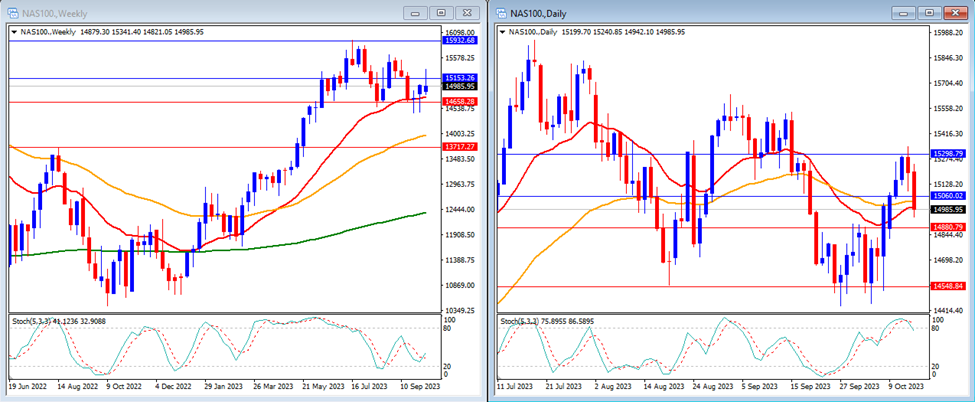
Last week, the NAS100 traded sideways but managed to reach our weekly and daily resistance levels. The NAS100 closed the week at a lower level of 14,985.
On the weekly timeframe, we can observe that the Stochastic Indicator is currently trending flat in the middle. Additionally, the price is above the 20-period, 50-period, and 200-period moving averages.
Our weekly resistance levels are 15,153 and 15,932, with support levels at 14,658 and 13,717.
On the daily timeframe, the Stochastic Indicator is within the overbought area. The price is currently trading around the 20-period and 50-period moving averages, but it remains above the 200-period moving average.
Our daily resistance levels are currently at 15,060 and 15,298, while support levels are at 14,880 and 14,548.
Conclusion: The US stock market is expected to undergo a week of high volatility, driven by the impact of US retail sales data as a significant market catalyst. We anticipate that NAS100 may trend lower as the market continues to assess the safe-haven status of the US Dollar, with a potential target at our support level of 14,880.
GBPUSD
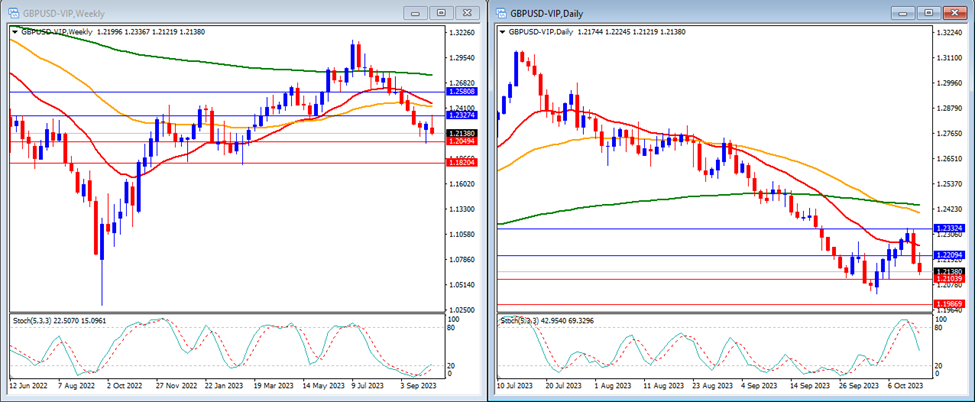
Last week, GBPUSD experienced a modest decline and successfully breached our support levels, closing the week at 1.2138.
On the weekly timeframe, the Stochastic Indicator is situated within the oversold area. The price is trading below the 20-period, 50-period, and 200-period moving averages, indicating a bearish trend.
Our weekly resistance levels are at 1.2327 and 1.2580, while support levels are at 1.2049 and 1.1820.
On the daily timeframe, our Stochastic Indicator is trending lower after exiting the overbought area, while the price is trading below the 20-period, 50-period, and 200-period moving averages.
Our daily resistance levels are now at 1.2209 and 1.2332, while support levels are at 1.2103 and 1.1986.
Conclusion: This week, we anticipate heightened volatility in GBPUSD due to the release of high-impact news, including UK inflation and retail sales data. Our expectation is that GBPUSD will continue to trend lower, with the potential to breach our support level at 1.2049.
USD Index
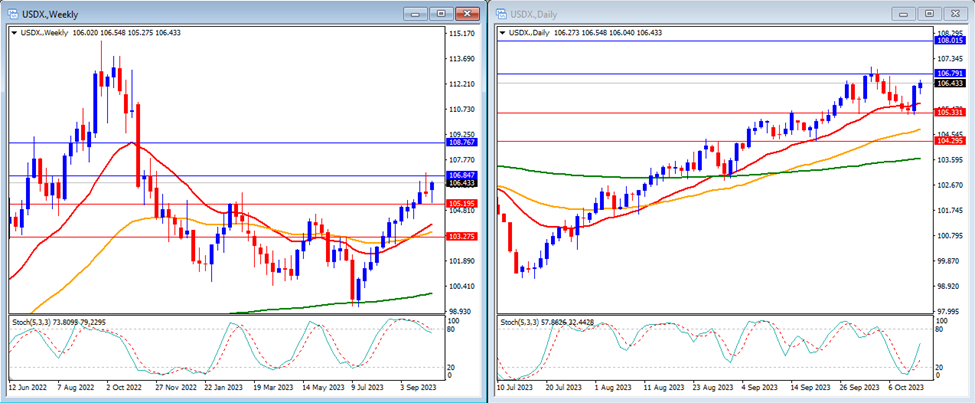
Last week, the USD Index saw an upward trend and approached our resistance levels, closing the week at 106.43.
On the weekly timeframe, the Stochastic Indicator is currently positioned within the overbought area. The price is trading above the 20-period, 50-period, and 200-period moving averages, suggesting a bullish trend in the USD Index.
Our weekly resistance levels are 106.84 and 107.98, with support levels at 105.19 and 103.27.
On the daily timeframe, the Stochastic Indicator is trending higher after exiting the oversold area. Additionally, the price is presently trading above the 20-period, 50-period, and 200-period moving averages.
Our daily resistance levels are 106.79 and 108.01, with support levels at 105.33 and 104.29.
Conclusion: This week, we expect the USD Index to experience significant volatility, primarily due to its status as a safe-haven asset. The market remains attentive to developments in the Middle East conflict, and high-impact news related to retail sales in the US will also be influential. Our anticipation is for the USD Index to maintain its upward trajectory and potentially reach our resistance level at 106.79.
USDJPY
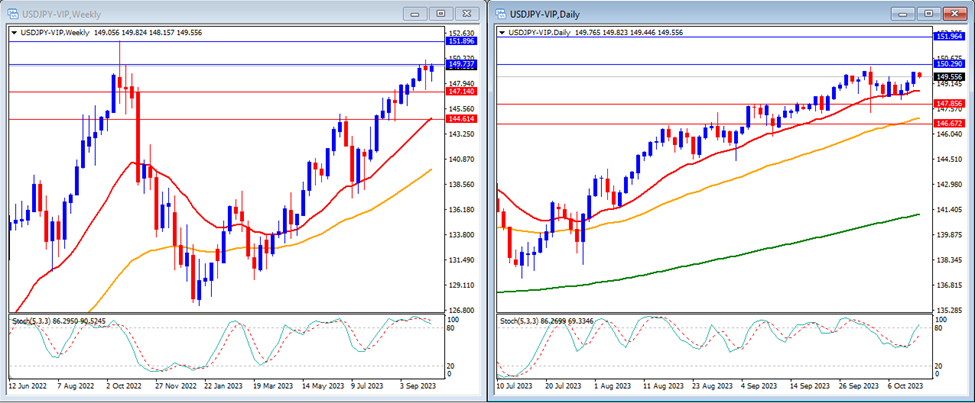
Last week, USDJPY experienced a relatively flat but upward movement, and it has now approached our resistance level. The week concluded with USDJPY closing at 149.55.
On the weekly timeframe, the Stochastic Indicator is presently situated within the overbought area. The price is trading above the 20-period, 50-period, and 200-period moving averages.
Our weekly resistance levels are 149.73 and 151.89, with support levels at 147.14 and 144.61.
On the daily timeframe, the Stochastic Indicator is moving higher, positioned just below the overbought area. The price continues to trade above the 20-period, 50-period, and 200-period moving averages.
Our daily resistance levels are currently at 150.29 and 151.96, while the support levels are at 147.85 and 146.67.
Conclusion: We anticipate a week of elevated volatility for USDJPY as the market closely monitors developments in the Middle East conflict and potential intervention by the Bank of Japan in the currency market. We expect the currency pair to trend higher, given that market sentiment still favors the USD as a safe haven. Our target is the potential reach of our resistance level at 149.73.
Make informed decisions with the most up-to-date and reliable financial data, exclusively provided by vtmarkets.com.