Spreads
Spreads
Spreads
Spreads
Spreads
Make informed decisions with the most up-to-date and reliable financial data, exclusively provided by vtmarkets.com.
EUR/USD Downtrend Continues After ECB’s Final Rate Hike
The Euro faced a significant decline following the European Central Bank’s unexpected 25 basis point rate hike, which the market interpreted as the final move in this direction. Despite some analysts and Governing Council members hoping for a pause, ECB President Lagarde’s decision spurred the Euro’s fall. The US Dollar, on the other hand, gained strength during the American session thanks to better-than-expected US economic data, including a notable increase in the Producer Price Index and positive retail sales figures. With the Euro’s vulnerability persisting due to the combination of robust US data and the dovish ECB rate hike, further losses may occur in response to changing market sentiment.
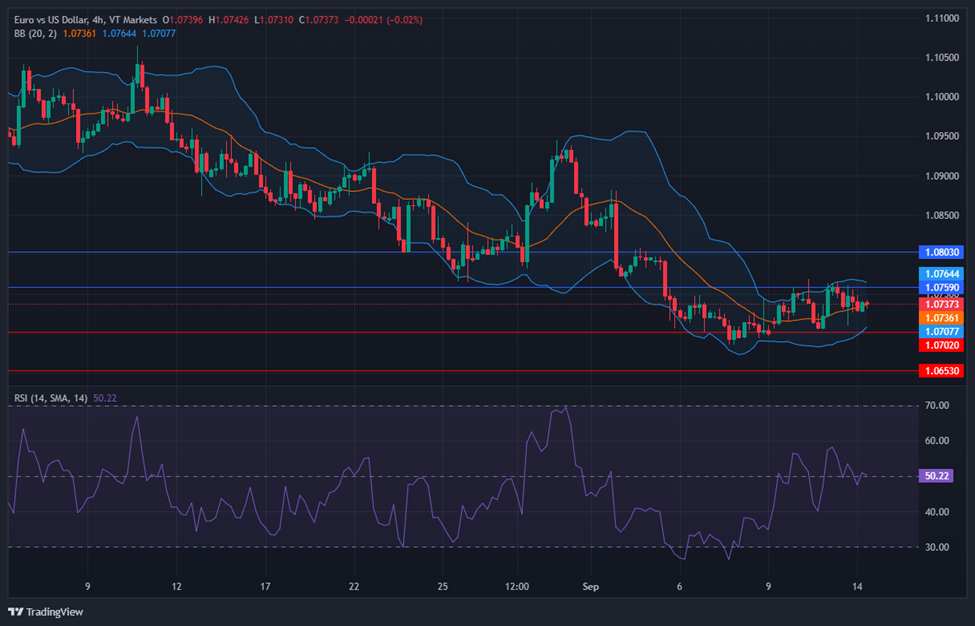
According to technical analysis, EUR/USD moved flat on Wednesday and is currently trading just around the middle band of the Bollinger Bands. This movement suggests the possibility of further consolidation. The Relative Strength Index (RSI) is currently at 50, indicating that EUR/USD is in a neutral stance.
Resistance: 1.0759, 1.0803
Support: 1.0702, 1.0653
XAU/USD React to ECB Rate Hike and Mixed US Data
Gold prices initially declined following the European Central Bank’s (ECB) unexpected 25 basis point rate hike and dovish statement. However, they later rebounded due to optimistic stock market performance, hovering around the $1,910 mark. Meanwhile, the US Dollar experienced mixed results from local data, with strong retail sales offset by higher-than-expected wholesale prices. Despite inflation concerns, investors remained skeptical about the Federal Reserve’s potential for another rate hike, leading to a shift in risk appetite. The market’s sentiment for the upcoming trading day hinges on China’s release of August Industrial Production and Retail Sales data during the Asian session.
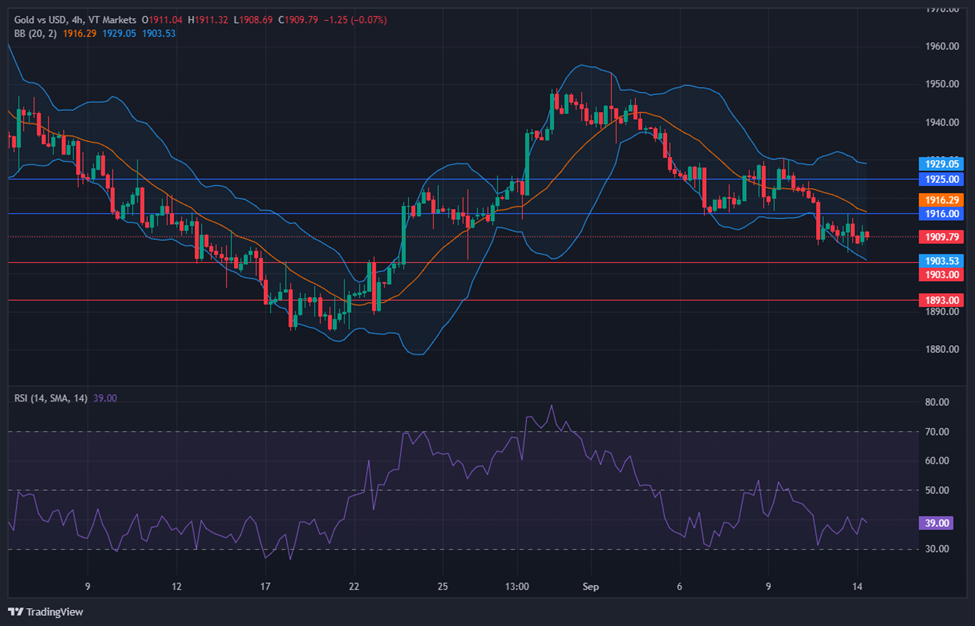
According to technical analysis, XAU/USD moved flat on Wednesday and moving between the lower and middle band of the Bollinger Bands. Currently, the price is trading slightly above the lower band with the potential for further downward movement. The Relative Strength Index (RSI) is currently at 39, indicating that the XAU/USD pair is still biased towards the bearish side.
Resistance: $1,916, $1,925
Support: $1,903, $1,893
Make informed decisions with the most up-to-date and reliable financial data, exclusively provided by vtmarkets.com.