Spreads
Spreads
Spreads
Spreads
Spreads
Make informed decisions with the most up-to-date and reliable financial data, exclusively provided by vtmarkets.com.
EUR/USD (4 Hours)
EUR/USD Reverses Gains Amidst US Inflation Data and Stronger Dollar
The EUR/USD initially surged above 1.1050 following US inflation data, but later retreated, erasing its daily gains as the US Dollar gained strength. The pair remained confined within a well-known range, influenced by key moving averages, while the robust US Dollar continued to limit its movement. The US inflation report for July indicated an annual Consumer Price Index (CPI) rate of 3.2%, slightly below the market consensus of 3.3%, with a monthly increase of 0.2%. Despite the rise, the report resembled pre-pandemic levels and did not signal the end of deflationary pressures. The US Dollar strengthened during the American session due to worsening market sentiment and higher US Treasury yields, with the US 10-year yield reaching 4.10%, its highest in three days. The US Dollar Index was on track for its strongest daily close in a month, surpassing 102.50. The report also highlighted an increase in Initial Jobless Claims to 248,000, above the expected 230,000. The upcoming US Producer Price Index data and Europe’s July inflation readings are expected to impact further developments. The EUR/USD’s price action hinges on USD dynamics, with potential weakening tied to improved risk sentiment and ongoing deflation in the US. However, current momentum still indicates Dollar strength..
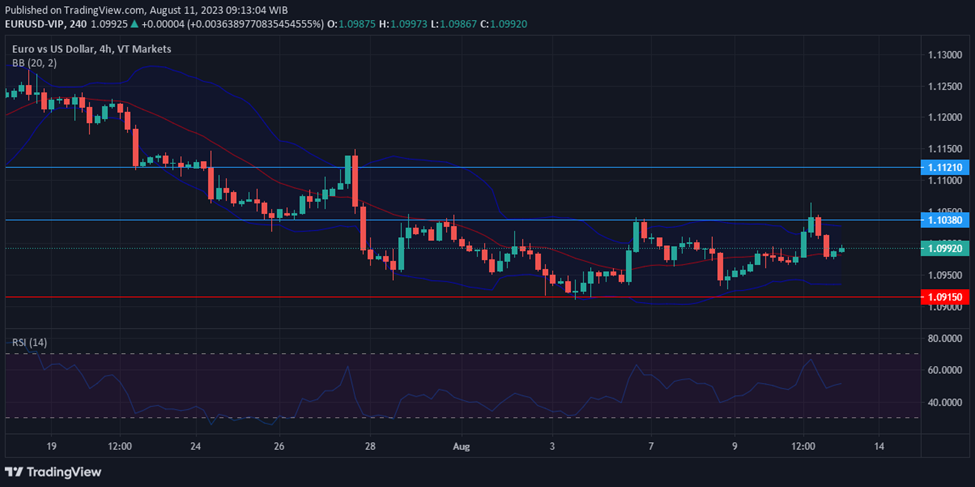
Based on technical analysis, the EUR/USD created a higher spike as the US CPI data was released lower than expected and reached the upper band of the Bollinger Bands. However, it then moved lower to reach the middle band and is currently experiencing a slight upward movement above the middle band of the Bollinger Bands. The Relative Strength Index (RSI) is currently at 51, indicating that the EUR/USD is in a consolidation phase.
Resistance: 1.1038, 1.1121
Support: 1.0915, 1.0839
XAU/USD (4 Hours)
XAU/USD Prices React to US CPI Release and Dollar Fluctuations
Gold prices experienced selling pressure, hovering around $1,920 after reaching a peak of $1,930.09 post the United States Consumer Price Index (CPI) release. The XAU/USD pair initially rose as China’s eased travel restrictions lifted sentiment and speculative interest shifted away from the US Dollar ahead of the inflation update. The CPI data, in line with expectations, showed a 0.2% monthly increase in July and a 3.2% yearly rise, slightly below the anticipated 3.3%. The core annual reading, at 4.7%, was a slight decline from June’s 4.8%. These figures supported the idea of a prolonged pause in Federal Reserve monetary tightening, leading to a decline in the US Dollar against major counterparts. However, Dollar strength returned later, erasing rivals’ gains influenced by the CPI data. Optimism waned after comments by Federal Reserve Bank of San Francisco President Mary Daly, emphasizing data-dependent rate decisions and noting that the CPI data, though as expected, doesn’t signal victory on inflation.
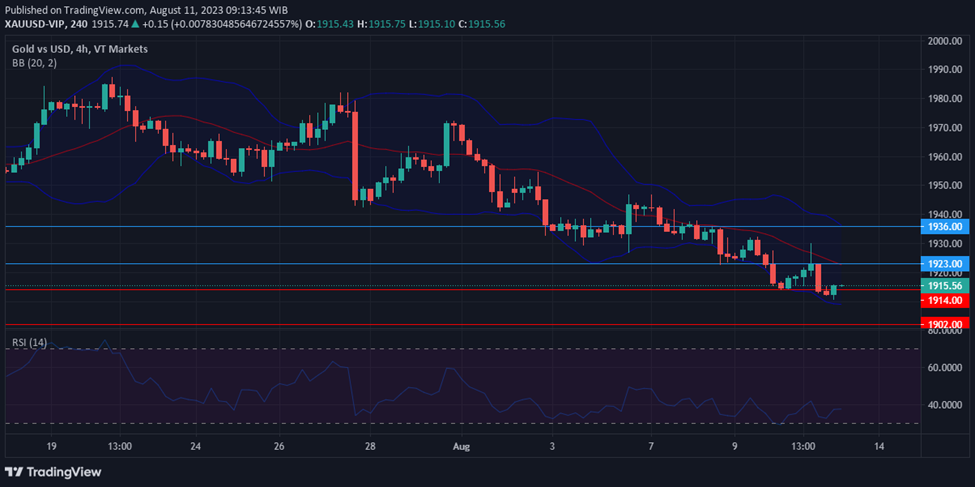
Based on technical analysis, the XAU/USD witnessed a slight decrease on Thursday following a previous upward movement triggered by the release of the US CPI data. The price managed to reach the middle band of the Bollinger Bands during this movement. At present, the price is retracing lower and is marginally positioned above the lower band of the Bollinger Bands. The Relative Strength Index (RSI) is currently at 37, indicating that the XAU/USD pair is exhibiting a somewhat bearish sentiment.
Resistance: $1,923, $1,936
Support: $1,914, $1,902
Make informed decisions with the most up-to-date and reliable financial data, exclusively provided by vtmarkets.com.