Spreads
Spreads
Spreads
Spreads
Spreads
Make informed decisions with the most up-to-date and reliable financial data, exclusively provided by vtmarkets.com.
Gold (XAUUSD)
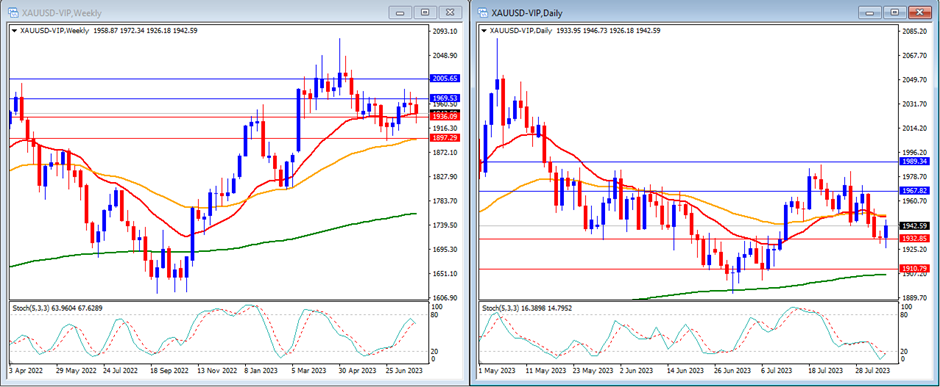
Last week, gold moved lower after a strong week for the US dollar. Gold closed the week back at $1,942.
On the weekly timeframe, we can see that the Stochastic Indicator is moving higher, targeting the overbought area. The gold price is now above the 20, 50, and 200-period moving averages.
Our weekly resistance levels are at $1,969 and $2,005, with support levels at $1,936 and $1,897.
On the daily timeframe, the Stochastic Indicator is moving lower entering the oversold area, while the price is currently below the 20 and 50, while still above the 200-period moving averages.
Our daily resistance levels are at $1,967 and $1,989, with support levels at $1,932 and $1,910.
Conclusion: This week, gold will experience high volatility with the release of US CPI and PPI. We anticipate that gold will move higher and attempt to reach our resistance level at $1,969.
EURUSD
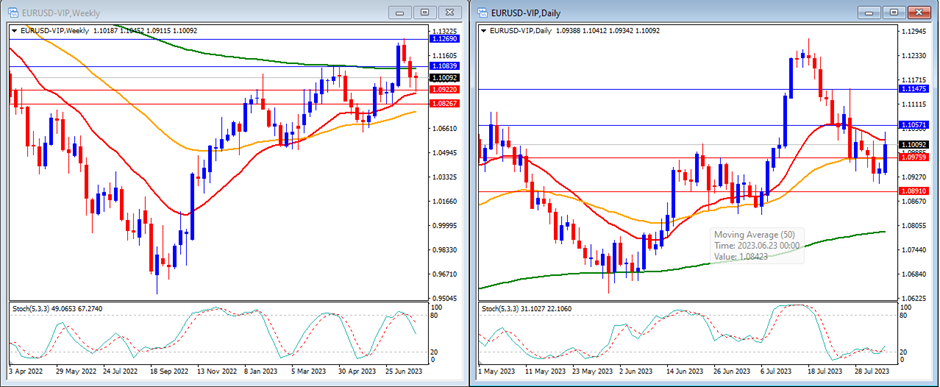
Last week, EURUSD moved lower and reached below our support levels. EURUSD closed the week at 1.1009.
On the weekly timeframe, the Stochastic Indicator is moving lower after exiting the overbought area. The price is currently trading above the 20 and 50 but below the 200-period moving averages.
Our weekly resistance levels are at 1.1083 and 1.1269, with support levels at 1.0922 and 1.0826.
On the daily timeframe, the Stochastic Indicator is moving flat just at the edge of the oversold area, while the price is moving below the 20, but still above the 50 and 200-period moving averages.
Our daily resistance levels are at 1.1057 and 1.1147, while the support levels are at 1.0975 and 1.0891.
Conclusion: This week, we expect high volatility for EURUSD due to the upcoming US inflation data. The current market sentiment favours the USD, but we anticipate that EURUSD will maintain its lower momentum, possibly reaching our support level at 1.0922.
DJ30
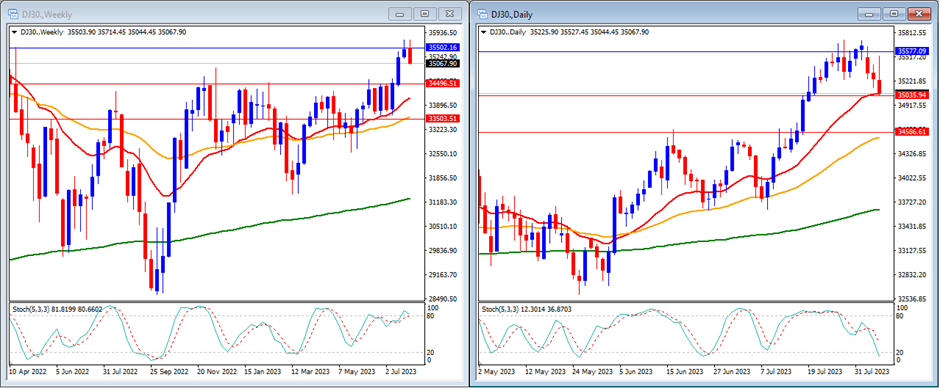
Last week, the DJ30 moved lower and was able to reach our daily support levels. The DJ30 closed the week higher at 35,067.
On the weekly timeframe, we can see that the Stochastic Indicator is flat just at the edge of the overbought area. The price is currently moving higher than the 20, 50 and 200-period moving averages.
Our weekly resistance levels are at 35,502 and 36,465, with support levels at 34,496 and 33,503.
On the daily timeframe, we can see that the stochastic indicator is moving lower targeting the oversold area. The price is now moving above the 20, 50, and 200-period moving averages.
Our daily resistance levels are at 35,577 and 35,967, with support levels at 35,035 and 34,586.
Conclusion: The US stock market is expected to experience a high volatility week as the market will focus on the US inflation data in CPI and PPI. We can anticipate the DJ30 to move slightly higher and reach our resistance level at 35,502.
USOUSD
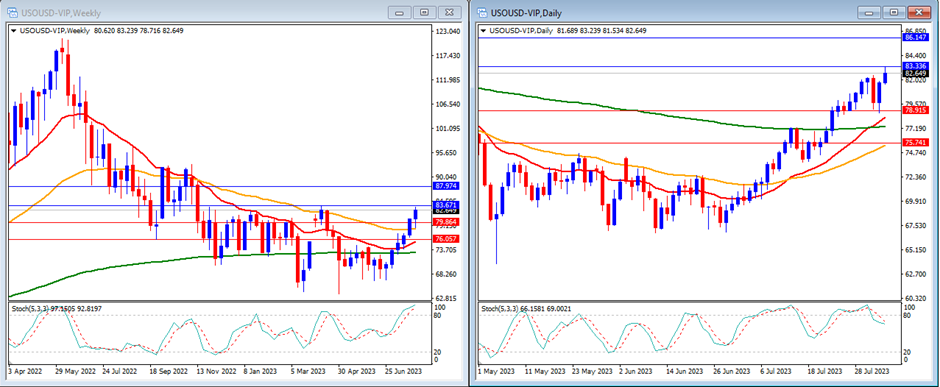
Last week, USOUSD (Oil) moved higher as expected and was able to reach our resistance levels. USOUSD closed the week at 82.64.
On the weekly timeframe, we can see that the Stochastic Indicator is moving higher entering the overbought area. The price is currently moving above the 20, 50 and 200-period moving averages.
Our weekly resistance levels are at 83.67 and 87.97, with support levels at 79.86 and 76.05.
On the daily timeframe, the Stochastic Indicator is moving lower after exiting the overbought area. The price is now moving above the 20, 50 and 200-period moving averages.
Our daily resistance levels are at 83.33 and 86.14, while support levels are at 78.91 and 75.74.
Conclusion: This week, there could be high volatility in USOUSD due to the upcoming US inflation data. We might witness a stronger upward movement with the potential to reach our resistance level at 83.33.
NAS100
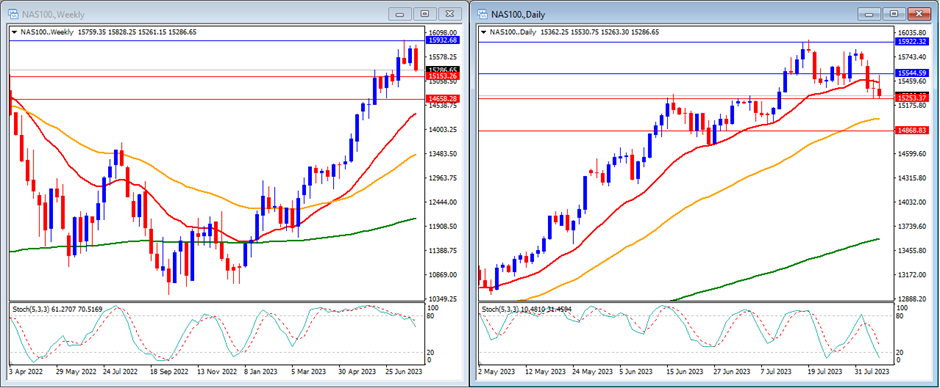
Last week, the NAS100 moved lower and was able to break our daily support levels. The NAS100 closed the week lower at 15,286.
On the weekly timeframe, we can see that the Stochastic Indicator is moving flat but slightly lower and exited the overbought area. The price is currently still moving above the 20, 50, and 200-period moving averages.
Our weekly resistance levels are at 15,932 and 16,407, with support levels at 15,153 and 14,658.
On the daily timeframe, the stochastic indicator is moving lower targeting the oversold area. The price is now moving below the 20, but still above the 50, and 200-period moving averages.
Our daily resistance levels are currently at 15,544 and 15,922, while support levels are at 15,253 and 14,868.
Conclusion: This week, the US stock market is expected to experience a high volatility week as the market will focus on US inflation data in CPI and PPI. We can anticipate the NAS100 to move slightly higher and reach our resistance level at 15,544.
GBPUSD
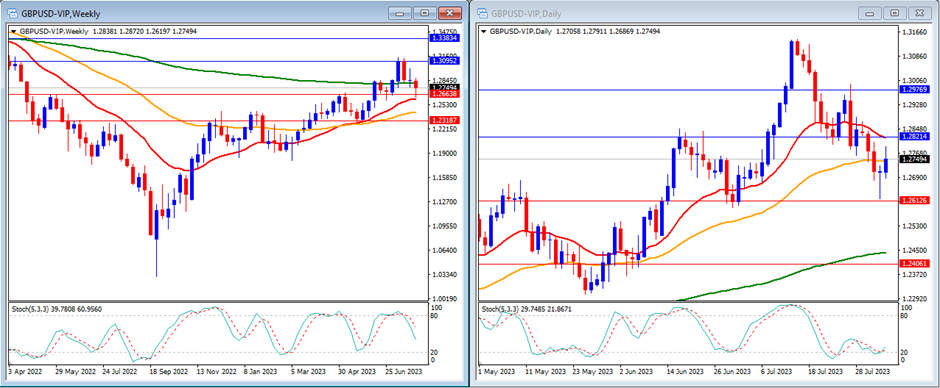
Last week, GBPUSD moved lower and reached our weekly support level. GBPUSD closed the week at 1.2749.
On the weekly timeframe, the Stochastic Indicator is moving lower, exiting the overbought area. The price is currently moving above the 20 and 50, but still below the 200-period moving averages.
Our weekly resistance levels are at 1.3095 and 1.3383, while support levels are at 1.2663 and 1.2318.
On the daily timeframe, our stochastic indicator is moving flat near the oversold area. The price is currently still moving below the 20, at the 50 and above the 200-period moving averages.
Our daily resistance levels are now at 1.2821 and 1.2976, while support levels are at 1.2612 and 1.2406.
Conclusion: This week, we can expect high volatility in GBPUSD as it will be affected by US inflation data. We anticipate some higher movement in the pair, with the potential of reaching higher to our resistance level at 1.2821.
USD Index
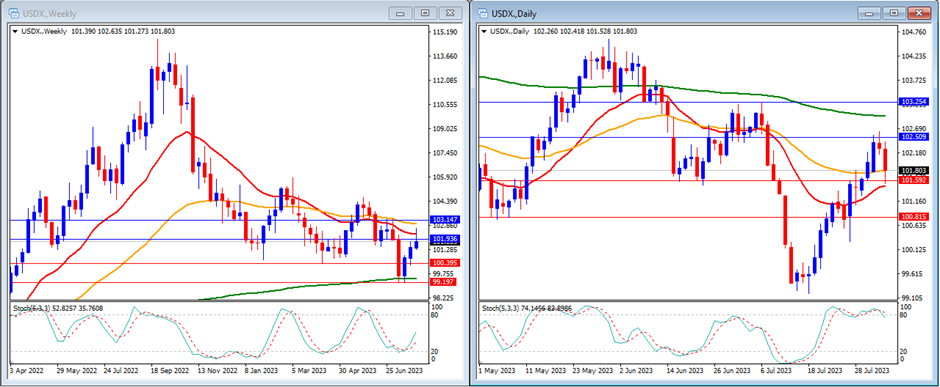
Last week, the USD Index moved higher and reached our resistance level at 101.93. The USD Index closed the week at 101.80.
On the weekly timeframe, we can see that the Stochastic Indicator is moving higher just above the oversold area. The price is currently below the 20 and 50, but still above the 200-period moving averages.
Our weekly resistance levels are at 101.93 and 103.14, with support levels at 100.39 and 99.19.
On the daily timeframe, the Stochastic Indicator is moving flat inside the overbought area. The price is now moving above the 20 and 50, but still below the 200-period moving averages.
Our daily resistance levels are at 102.50 and 103.25, with support levels at 101.59 and 100.81.
Conclusion: We anticipate a potential lower movement in the USD Index, with the possibility of reaching our support level at 101.59.
USDJPY
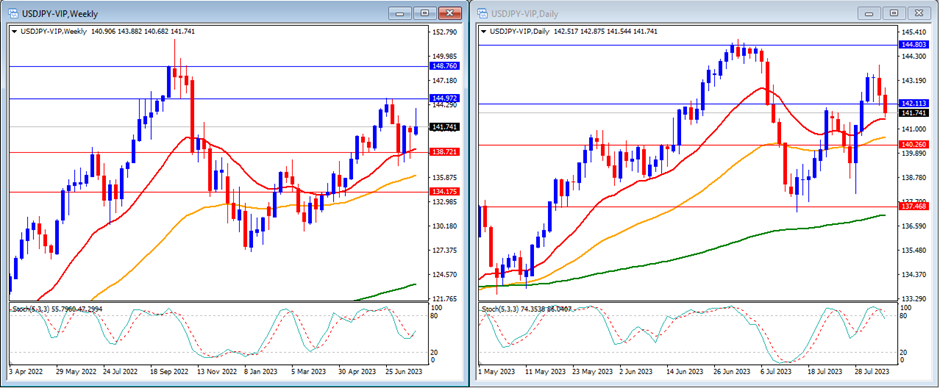
Last week, USDJPY was able to move slightly higher. USDJPY closed the week at 141.74.
On the weekly timeframe, we can observe that the Stochastic Indicator moving in the middle. The price is still moving above the 20, 50, and 200-period moving averages.
Our weekly resistance levels are at 144.97 and 148.76, with support levels at 138.72 and 134.17.
On the daily timeframe, the stochastic indicator is inside the overbought area. The price is now moving above the 20, 50, and 200-period moving averages.
Our daily resistance levels are currently at 142.11 and 144.80, while the support levels are at 140.26 and 137.46.
Conclusion: This week, USDJPY is expected to experience high volatility as the market waits for the US inflation data. We anticipate that the pair will move higher and potentially reach above our resistance level at 142.11.
Make informed decisions with the most up-to-date and reliable financial data, exclusively provided by vtmarkets.com.