Spreads
Spreads
Spreads
Spreads
Spreads
Gold (XAUUSD)
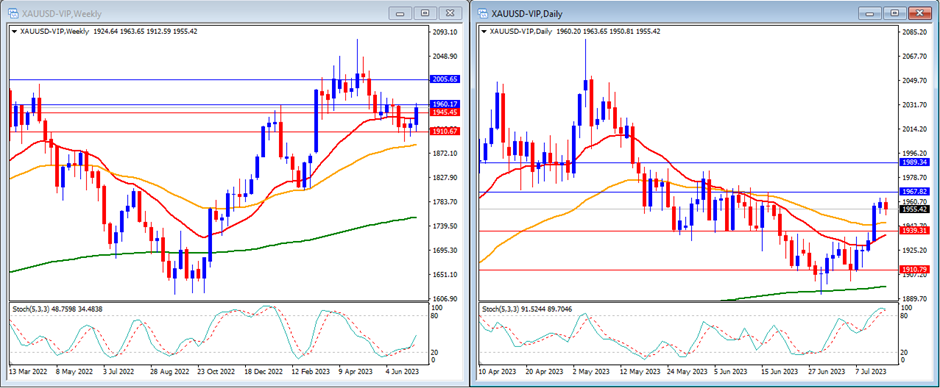
Last week, gold moved higher as expected and was able to reach above our weekly resistance level. Gold closed the week back at $1,955.
On the weekly timeframe, we can see that the Stochastic Indicator exited the oversold area. This indicates that gold is starting to show signs of a bullish reversal. The gold price is now moving above the 20-period, 50, and 200-period moving averages.
Our weekly resistance levels are at $1,960 and $2,005, with support levels at $1,945 and $1,910.
On the daily timeframe, the Stochastic Indicator is moving inside the overbought area, while the price is currently above the 20, 50 and 200-period moving averages.
Our daily resistance levels are at $1,967 and $1,989, with support levels at $1,939 and $1,910.
Conclusion: This week, gold may witness a period of lower volatility. We’re predicting a downward trend for gold, potentially dipping below our support levels at $1,945.
EURUSD
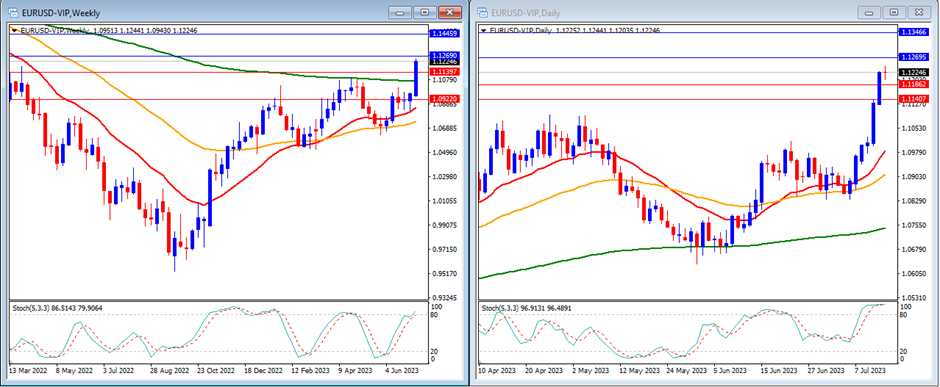
Last week, EURUSD moved higher and was able to reach above the 1.1 level as expected. EURUSD closed the week at 1.1224.
On the weekly timeframe, the Stochastic Indicator is moving strongly higher entering the overbought area. The price is currently trading above the 20, 50, AND 200-period moving averages.
Our weekly resistance levels are at 1.1269 and 1.1445, with support levels at 1.1139 and 1.0922.
On the daily timeframe, the Stochastic Indicator is moving flat inside the overbought area, while the price is still moving above the 20, 50 and 200-period moving averages.
Our daily resistance levels are at 1.1269 and 1.1346, while the support levels are at 1.1186 and 1.1140.
Conclusion: No major news events are anticipated from the EU this week. Given the current market sentiment leaning in favour of the Euro, we foresee the EURUSD pair maintaining its ascending trajectory, possibly hitting our resistance level of 1.1269.
DJ30
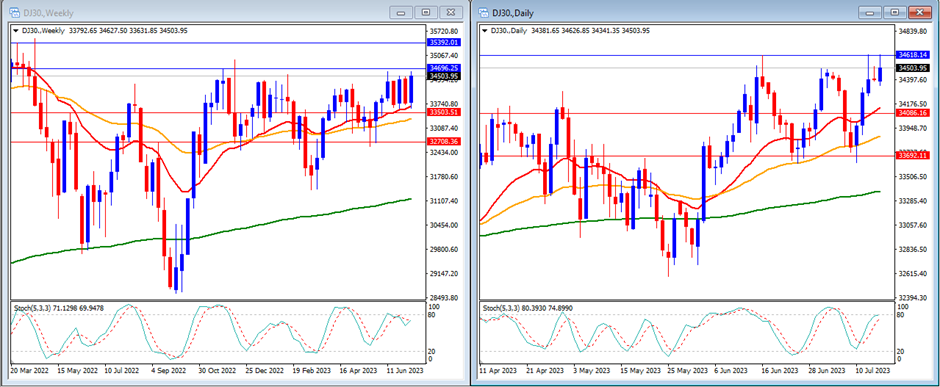
The DJ30 experienced an upward trend as predicted, successfully surpassing our resistance levels. The index concluded the week on a high note, closing at 34,503.
On the weekly timeframe, we can see that the Stochastic Indicator is moving in consolidation just below the overbought area. The price is moving higher than the 20, 50 and 200-period moving averages.
Our weekly resistance levels are at 34,696 and 35,392, with support levels at 33,503 and 32,708.
On the daily timeframe, we can see that the stochastic indicator is moving strongly higher targeting the overbought area. The price is now moving above the 20, 50, and 200-period moving averages.
Our daily resistance levels are at 34,618 and 35,042, with support levels at 34,806 and 33,692.
Conclusion: The US stock market is projected to see minimal volatility this week, given the lingering market sentiment favouring last week’s slower inflation. This could lead to expectations that the Fed might maintain its current interest rates in the subsequent meeting, which could positively influence the stock market. We anticipate a slight upward movement of the DJ30, potentially reaching our resistance level at 34,618.
USOUSD
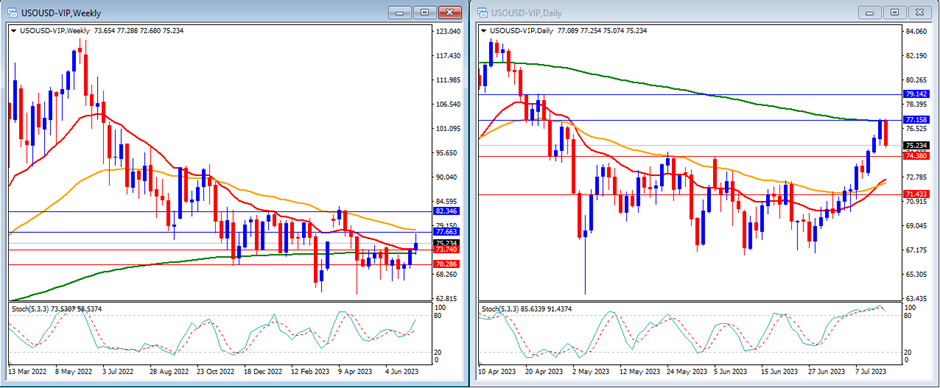
Last week, USOUSD (Oil) moved higher as expected and was able to break our resistance levels. USOUSD closed the week at 75.23.
On the weekly timeframe, we can see that the Stochastic Indicator is moving in the middle and trying to move higher. The price is moving below the 50 but above the 20 and 200-period moving averages.
Our weekly resistance levels are at 77.66 and 82.34, with support levels at 73.74 and 70.28.
On the daily timeframe, the Stochastic Indicator is moving inside the overbought area. The price is now moving above the 20 and 50, but still below the 200-period moving averages.
Our daily resistance levels are at 77.15 and 79.14, while support levels are at 74.38 and 71.43.
Conclusion: This week may see the USOUSD experiencing low volatility due to the lack of significant data from the US. Uncertain conditions related to supply could also impact the USOUSD price. We anticipate a more pronounced upward trend, with the potential to hit our resistance level at 77.66.
NAS100
Last week, the NAS100 trended upward, successfully surpassing our anticipated resistance level. The index ended the week on a positive note, closing at 15,566.
On the weekly timeframe, we can see that the Stochastic Indicator is still within the overbought range. The price is currently still moving above the 20, 50, and 200-period moving averages.
Our weekly resistance levels are at 15,681 and 16,407, with support levels at 15,153 and 14,658.
On the daily timeframe, the stochastic indicator is moving higher targeting the overbought area. The price is still moving above the 20, 50, and 200-period moving averages.
Our daily resistance levels are currently at 15,666 and 16,027, while support levels are at 15,253 and 14,866.
Conclusion: This week, the US stock market is predicted to be calmer because people still prefer the slower rise in prices from last week. The Fed might not change interest rates in its next meeting. This could make the stock market better. We expect the NAS100 to go up a bit and reach our resistance level at 15,681.
GBPUSD
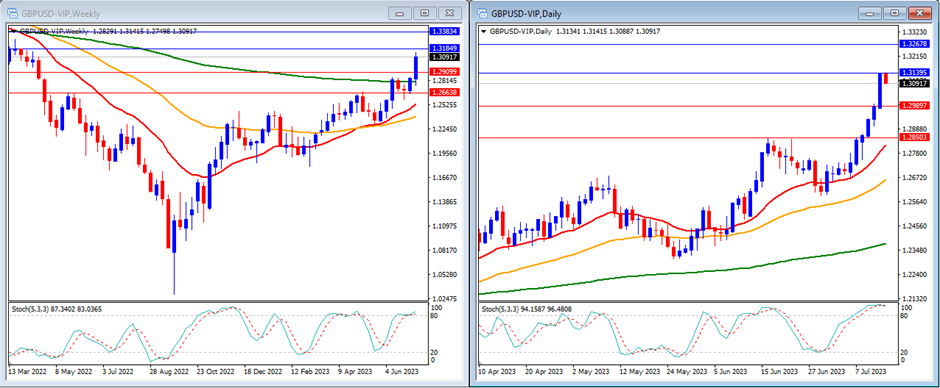
Last week, GBPUSD moved higher as expected and was able to break our resistance levels. GBPUSD closed the week at 1.3091.
On the weekly timeframe, the Stochastic Indicator is moving higher entering the overbought area. The price is currently moving above the 20, 50 and 200-period moving averages.
Our weekly resistance levels are at 1.3184 and 1.3383, while support levels are at 1.2909 and 1.2663.
On the daily timeframe, our stochastic indicator is moving strongly inside the overbought area. The price is currently still moving above the 20, 50 and 200-period moving averages.
Our daily resistance levels are now at 1.3139 and 1.3267, while support levels are at 1.2989 and 1.2850.
Conclusion: This week, the GBPUSD currency pair is likely to experience significant price swings due to the impact of the UK CPI data release. We expect the GBPUSD to move in a somewhat sideways pattern, with the possibility of declining and dropping below the 1.3 level.
USD Index
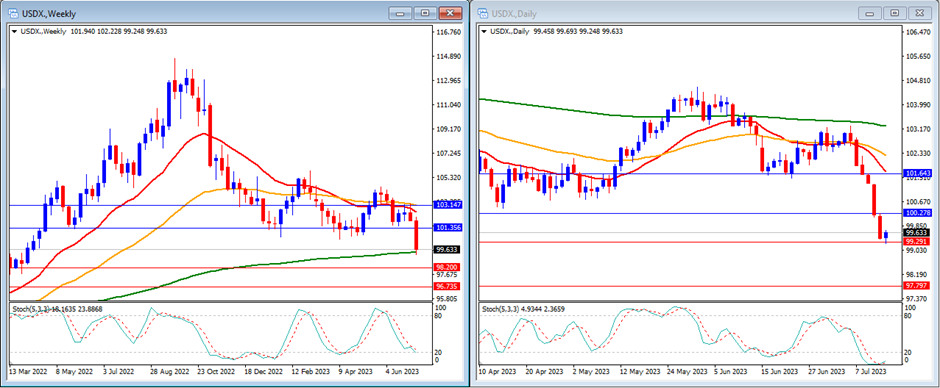
As anticipated, the USD Index declined last week, influenced by the release of US inflation data, which was lower than expected. The week concluded with the USD Index closing at 99.63.
On the weekly timeframe, we can see that the Stochastic Indicator is moving lower targeting the oversold area. The price is below the 20 and 50, but still above the 200-period moving averages.
Our weekly resistance levels are at 101.35 and 103.14, with support levels at 98.20 and 96.73.
On the daily timeframe, the Stochastic Indicator is moving inside the oversold area. The price is still moving below the 20, 50 and 200-period moving averages.
Our daily resistance levels are at 100.27 and 101.63, with support levels at 99.29 and 97.79.
Conclusion: This week, the USD Index is expected to continue its trend from last week, possibly showing a lack of demand. The US retail sales data could have a slight impact on the market. We anticipate a potential decline in index, with the possibility of reaching our support level at 99.29.
USDJPY
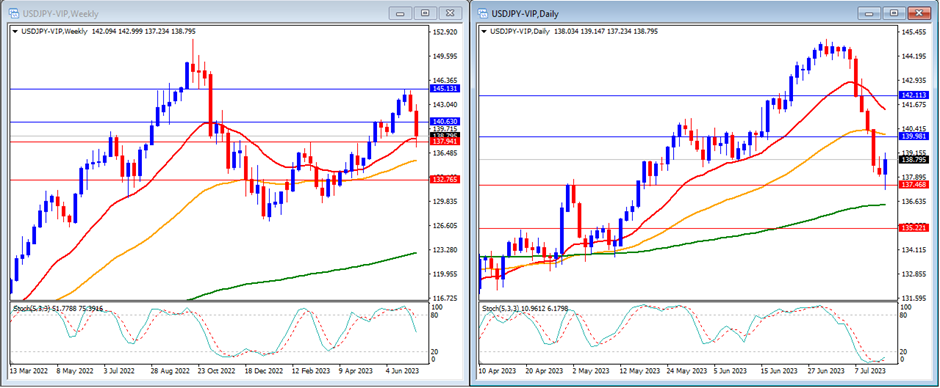
USDJPY followed the anticipated path and moved lower. This was driven by reduced demand for the US Dollar, which benefited the Japanese Yen. At the end of the week, USDJPY closed at 137.94.
On the weekly timeframe, we can observe that the Stochastic Indicator exiting the overbought area. The price is still moving above the 20, 50, and 200-period moving averages.
Our weekly resistance levels are at 140.63 and 145.13, with support levels at 137.94 and 132.76.
On the daily timeframe, the stochastic indicator is moving strongly lower inside the oversold area. The price is now moving below the 20 and 50, but still above the 200-period moving averages.
Our daily resistance levels are currently at 139.98 and 142.11, while the support levels are at 137.46 and 135.22.
Conclusion: This week, USDJPY is predicted to have limited fluctuations and move in line with the US Dollar’s overall movement. However, the market sentiment could shift based on the release of the US inflation data. We expect USDJPY to decline and potentially break below our support level at 137.46.