Spreads
Spreads
Spreads
Spreads
Spreads
Gold (XAUUSD)
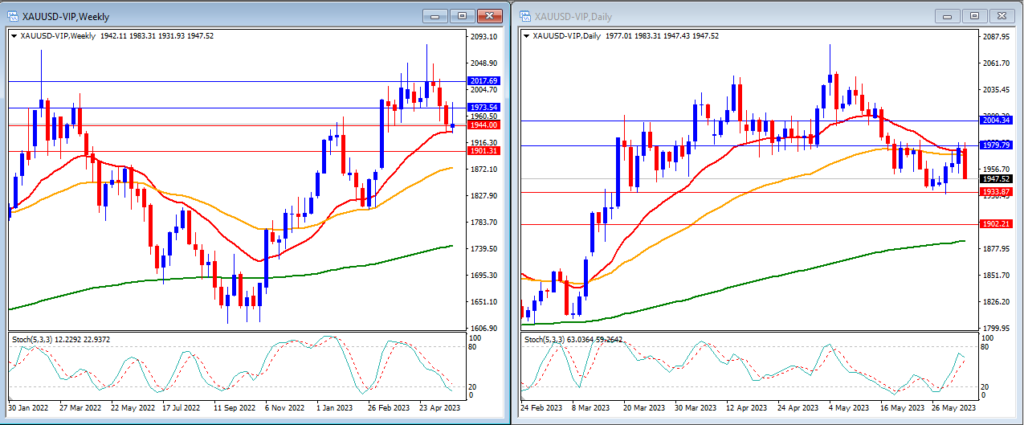
Last week, gold experienced high volatility, reaching a swing high before retreating lower. Gold closed the week at $1,947, just above the support level.
On the weekly timeframe, the Stochastic Indicator is seen moving lower and entering the oversold territory. This suggests that gold is in a bearish phase but is beginning to show signs of exhaustion. Meanwhile, the gold price remains above the 20, 50, and 200-period moving averages.
Our weekly resistance levels are at $1,973 and $2,017, with support levels at $1,944 and $1,901.
On the daily timeframe, the Stochastic Indicator is moving higher in the middle targeting the overbought area. The price is currently below the 20 and 50-period moving averages, but still above the 200-period moving average.
Our daily resistance levels are at $1,979 and $2,004, with support levels at $1,933 and $1,902.
Conclusion: This week, gold’s movement will primarily be influenced by market sentiment and technical factors, as there is not much data released from the US. We expect gold to move slightly higher this week and potentially reach our resistance levels at $1,973 and $1,979.
EURUSD
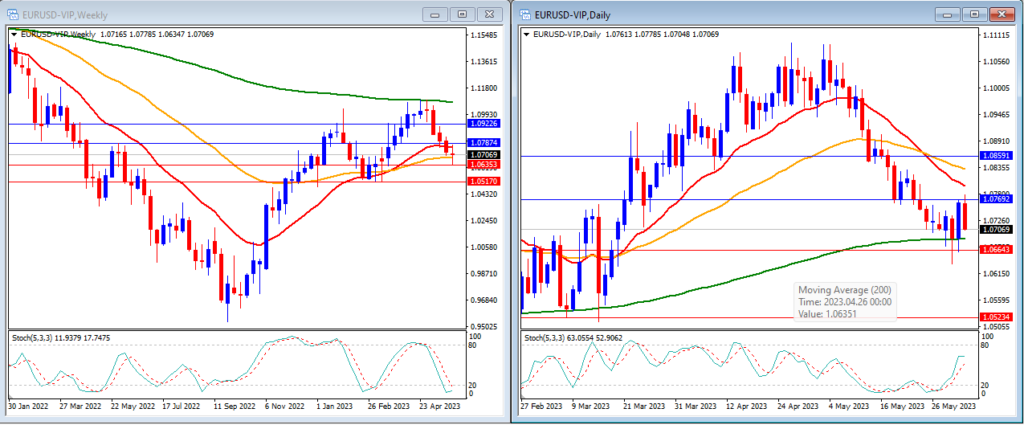
The EURUSD moved flat last week after being lower for 3 consecutive weeks. The pair closed the week at 1.0706.
On the weekly timeframe, the Stochastic Indicator is moving lower entering the oversold area. The price is currently trading below the 20 and 200-period moving averages, but just above the 50-period moving average.
Our weekly resistance levels are at 1.0874 and 1.0922, with support levels at 1.0635 and 1.0517.
On the daily timeframe, the Stochastic Indicator is moving higher in the middle. The price is now moving below the 20 and 50-period moving averages, but still above the 200-period moving average.
Our daily resistance levels are at 1.0769 and 1.0859, while the support levels are at 1.0664 and 1.0523.
Conclusion: With limited data releases from the US and the EU this week, the movement in EURUSD will likely be driven by technical analysis and market sentiment. We anticipate a corrective move higher for EURUSD, potentially reaching our resistance level at 1.0787.
DJ30
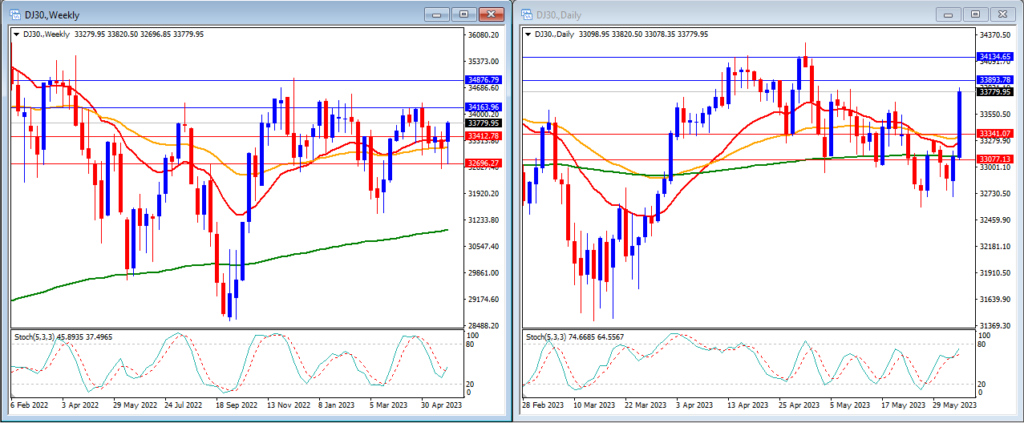
Last week, the DJ30 saw an upward movement, briefly dipping below our support level mid-week before a strong surge towards the end of the week. The DJ30 closed the week slightly higher at 33,779.
On the weekly timeframe, we can observe that the Stochastic Indicator is crossing higher in the middle. The price is currently moving higher than the 20, 50 and 200-period moving average.
Our weekly resistance levels are at 34,163 and 34,876, with support levels at 33,412 and 32,696.
On the daily timeframe, we can see that the stochastic indicator is moving strongly higher and targeting the overbought area. The price is moving above all the 20, 50 and 200-period moving averages.
Our daily resistance levels are at 33,893 and 34,134, with support levels at 33,341 and 33,077.
Conclusion: Following the approval of the US debt ceiling agreement, we can expect a positive sentiment in the market. This week, US stocks may likely strengthen, and higher volatility in the US stock market can be anticipated. We predict that the DJ30 will move higher and potentially surpass our resistance level at 33,893.
USOUSD
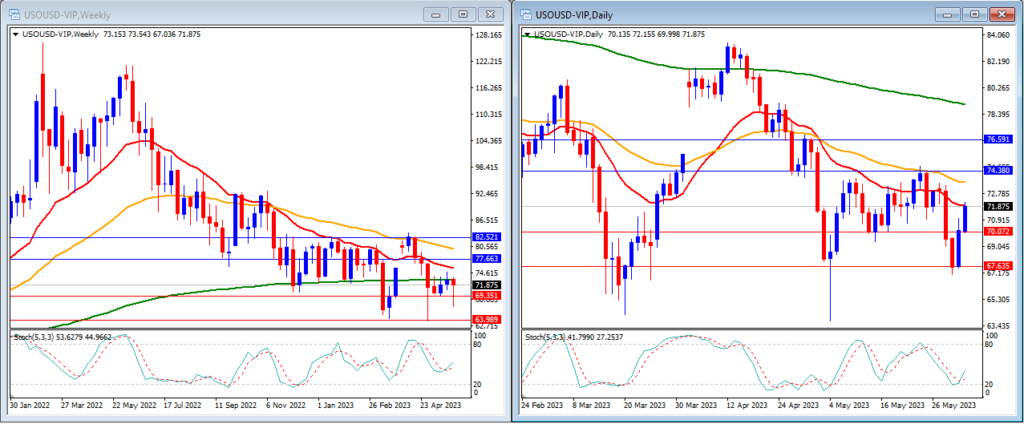
Last week, USOUSD (Oil) experienced a downward movement in the middle of the week but managed to rebound higher towards the end of the week. USOUSD closed the week at 71.87.
On the weekly timeframe, we can observe that the Stochastic Indicator is moving in the middle with no clear direction. The price is currently moving below the 20, 50, and 200-period moving averages.
Our weekly resistance levels are at 77.66 and 82.52, with support levels at 69.35 and 63.98.
On the daily timeframe, the Stochastic Indicator is moving just crossing back higher, just above the oversold region. The price is now moving just at the 20, but still below the 50, and 200-period moving averages.
Our daily resistance levels are at 74.38 and 76.59, while support levels are at 70.07 and 67.63.
Conclusion: Following the weak movement in the middle of last week, it appears that the US debt ceiling also influenced oil prices. This week, the market’s focus will be on the OPEC+ meeting. We may see a slight downward movement in oil prices this week, potentially reaching below our support level at 70.07.
NAS100
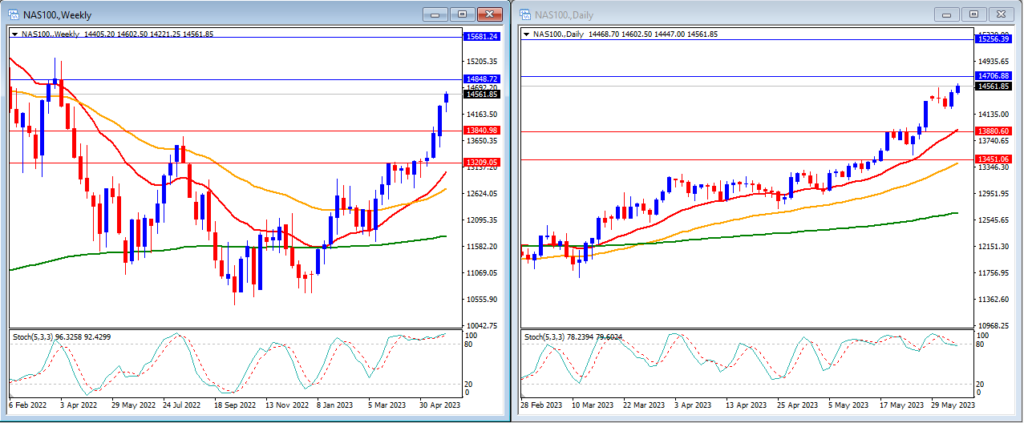
The NAS100 continued its positive trend last week by rising slightly higher. The NAS100 closed the week with an increase, settling at 14,561.
On the weekly timeframe, we can observe that the Stochastic Indicator is still within the overbought range. The price is currently moving above the 20, 50, and 200-period moving averages.
Our weekly resistance levels are at 14,848 and 15,681, with support levels at 13,840 and 13,209.
On the daily timeframe, the stochastic indicator is moving around the overbought level. The price is moving above the 20, 50, and 200-period moving averages.
Our daily resistance levels are currently at 14,706 and 15,256, while support levels are at 13,880 and 13,451.
Conclusion: Following the approval of the US debt ceiling agreement, we can expect a positive sentiment in the market. This week, US stocks may likely strengthen, and higher volatility in the US stock market can be anticipated. We predict that the NAS100 will move higher and potentially surpass our resistance level at 14,706.
GBPUSD
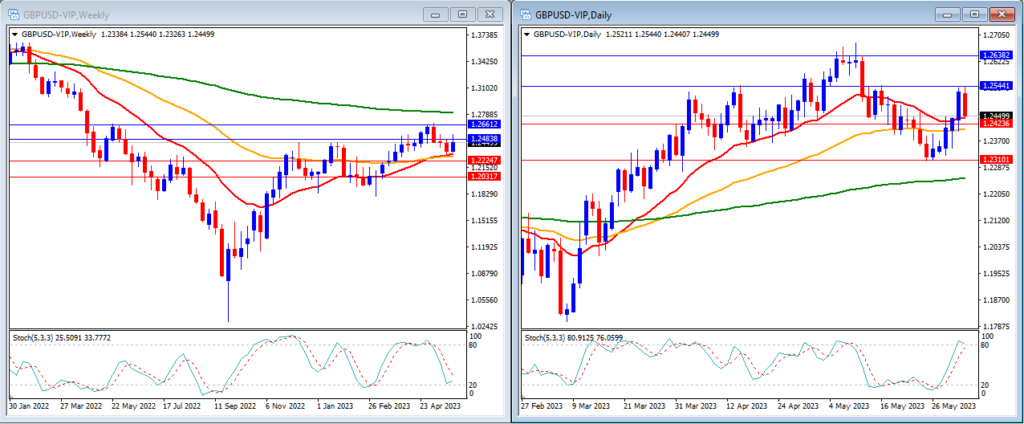
Last week, GBPUSD saw a slight increase and managed to rise above our daily resistance level. GBPUSD closed the week at 1.2449, just below our weekly resistance level.
On the weekly timeframe, the Stochastic Indicator is showing strong downward movement targeting the oversold area. The price is currently moving above the 20 and 50-period moving averages, but below the 200-period moving average.
Our weekly resistance levels are at 1.2483 and 1.2661, while support levels are at 1.2224 and 1.2031.
On the daily timeframe, our stochastic indicator is moving strongly higher and targeting the overbought level. The price is currently moving above the 20, 50 and 200-period moving averages.
Our daily resistance levels are now at 1.2544 and 1.2638, while support levels are at 1.2272 and 1.2112.
Conclusion: We can expect some fluctuations in the GBPUSD this week due to the contradiction between daily and weekly stochastic indicators observed in the technical analysis. For this week, we anticipate another swing high and low movement in GBPUSD, with the potential to reach higher towards our resistance levels at 1.2544.
USD Index
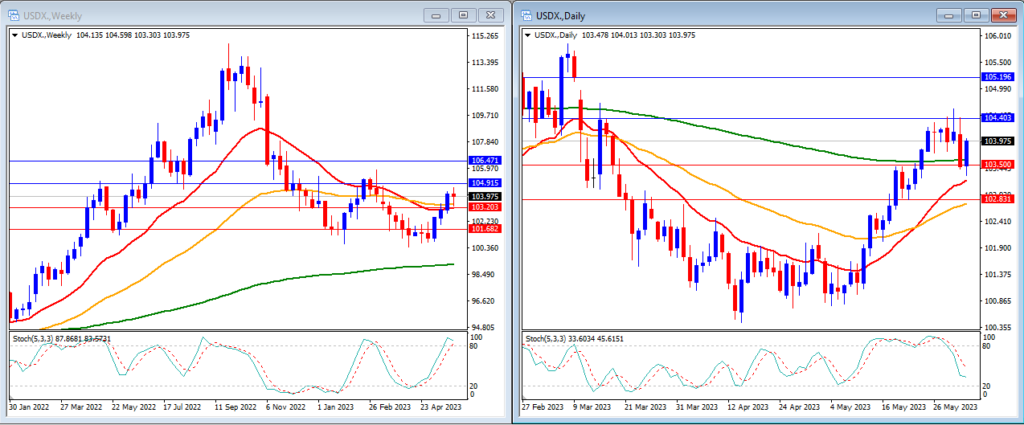
Last week, the USD Index remained relatively flat, influenced by the US debt ceiling agreement and the US Jobs Report. The USD Index experienced a downward movement on Thursday but managed to recover and move higher on Friday. The USD Index closed the week at 103.97.
On the weekly timeframe, we can observe that the Stochastic Indicator is showing strong upward movement, entering the overbought region. The price is currently above the 20, 50, and 200-period moving averages.
Our weekly resistance levels are at 104.91 and 106.47, with support levels at 103.20 and 101.68.
On the daily timeframe, the Stochastic Indicator is moving lower in the middle targeting the oversold level. The price is now moving above the 20, 50, and just slightly below the 200-period moving averages.
Our daily resistance levels are 104.40 and 105.19, with support levels at 103.50 and 102.83.
Conclusion: This week, we can expect low volatility in the USD Index as the market is still awaiting the implementation of the agreement on the US debt ceiling. Although the US ISM Services PMI data will be released, it may not have a significant impact on the USD Index. We anticipate that the USD Index might rise further and reach our resistance level of 104.91.
USDJPY
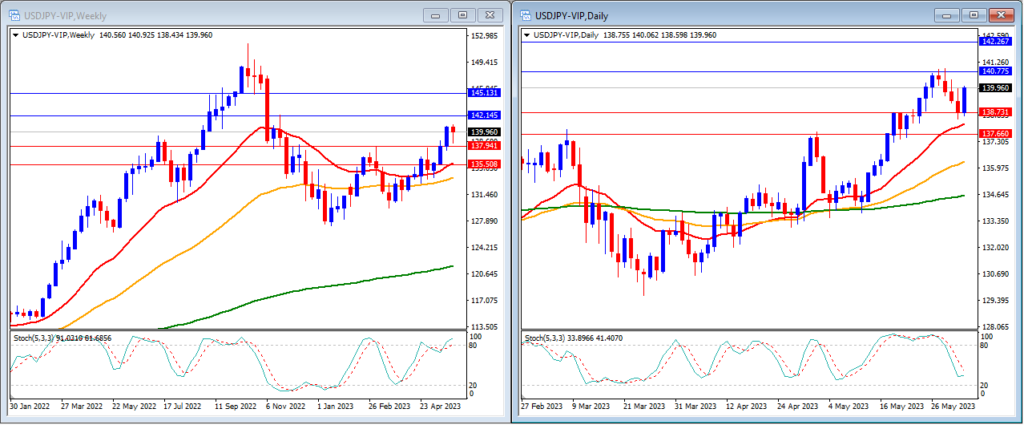
Last week, USDJPY managed to move higher towards the end of the week, partially offsetting losses from the first few days. USDJPY closed the week at 139.96.
On the weekly timeframe, we can observe that the Stochastic Indicator is moving higher, entering the overbought zone. The price is above the 20, 50, and 200-period moving averages.
Our weekly resistance levels are at 142.14 and 145.13, with support levels at 137.94 and 135.50.
On the daily timeframe, the stochastic indicator is still moving lower in the middle. The price is still above the 20, 50, and 200-period moving averages.
Our daily resistance levels are currently at 140.77 and 142.26, while the support levels are at 138.73 and 137.66.
Conclusion: This week, USDJPY is expected to be influenced by the US Dollar movement, as there are no high-impact news releases from Japan. We anticipate that USDJPY will continue to rise and reach our next resistance level at 140.77.