Spreads
Spreads
Spreads
Spreads
Spreads
Gold (XAUUSD)
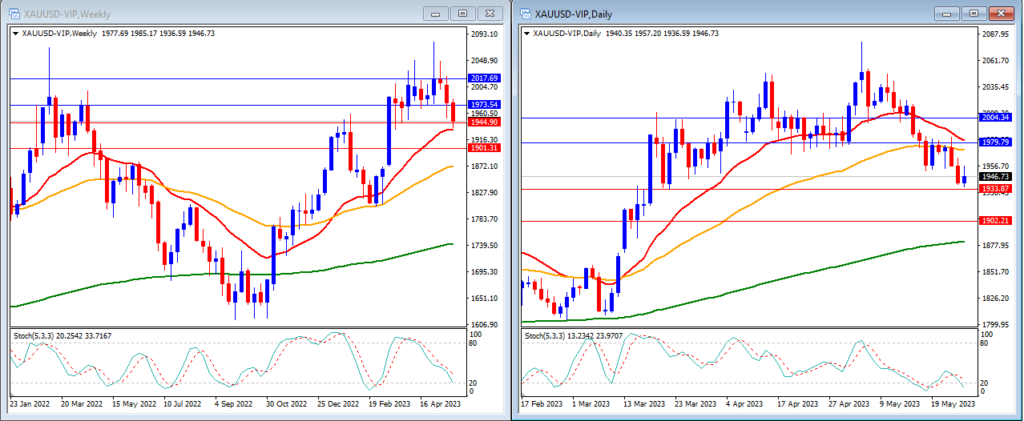
Gold declined last week as anticipated, breaking past the initial daily and weekly support levels, and closing at $1,946.
On the weekly timeframe, we can observe that the Stochastic Indicator is still moving lower, nearing the oversold area. This indicates that gold is in a bearish mode but starting to show signs of exhaustion. The gold price remains above the 20, 50, and 200-period moving averages.
Our weekly resistance levels are at $1,973 and $2,017, with support levels at $1,944 and $1,901.
On the daily timeframe, the Stochastic Indicator is moving lower, just outside the oversold area. The price is currently below the 20 and 50-period moving averages, but still above the 200-period moving average.
Our daily resistance levels are at $1,979 and $2,004, with support levels at $1,933 and $1,902.
Conclusion: This week, attention turns to US Jobs Reports, encompassing JOLTS, ADP Non-Farm, Non-Farm Employment, and Unemployment rate. Gold prices may see high volatility, with a potential dip to $1,933 support before rebounding towards $1,979 resistance.
EURUSD
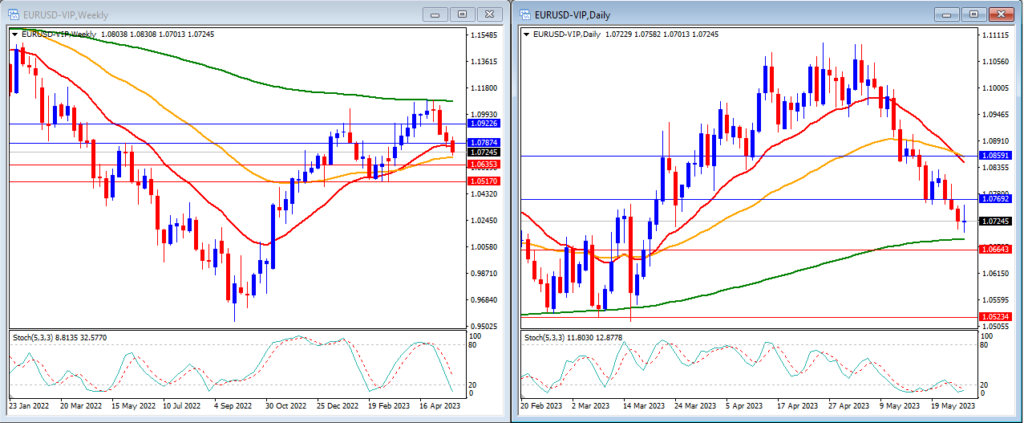
EURUSD extended its decline last week, breaking through support levels and closing at 1.0724.
On the weekly timeframe, the Stochastic Indicator is moving lower, targeting the oversold area. The price is currently trading below the 20 and 200-period moving averages, but just above the 50-period moving average.
Our weekly resistance levels are at 1.0874 and 1.0922, with support levels at 1.0635 and 1.0517.
On the daily timeframe, the Stochastic Indicator is within the oversold level. The price is now moving below the 20 and 50-period moving averages, but still above the 200-period moving average.
Our daily resistance levels are at 1.0769 and 1.0859, while the support levels are at 1.0664 and 1.0523.
Conclusion: The US Jobs Report this week may cause market fluctuations in major currencies, including EURUSD. A potential corrective move could see EURUSD reaching the 1.08 level.
DJ30
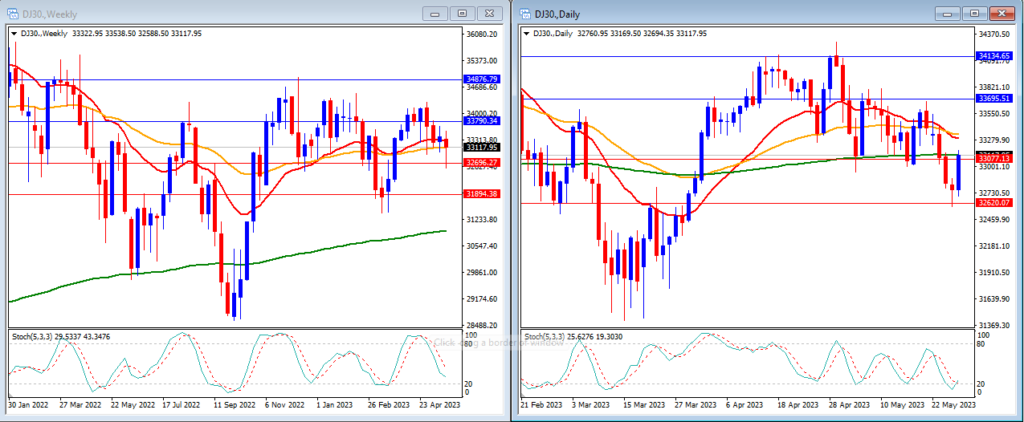
Last week, the DJ30 experienced a slight decline but managed to fluctuate within our support and resistance levels. The DJ30 closed the week lower at 33,117, just above our daily support level.
On the weekly timeframe, we can observe that the Stochastic Indicator is moving lower in the middle range. The price is currently hovering around the 20 and 50-period moving averages but still remains above the 200-period moving average.
Our weekly resistance levels are at 33,790 and 34,876, with support levels at 32,696 and 31,894.
On the daily timeframe, we can see that the stochastic indicator is slightly above the oversold area. The price is moving below the 20 and 50-period moving averages and has just breached the 200-period moving average.
Our daily resistance levels are at 33,695 and 34,134, with support levels at 33,077 and 32,620.
Conclusion: With US debt ceiling discussions and the upcoming US Jobs report, sudden stock market volatility is expected. DJ30 might move lower, possibly breaking below the 33,077 support level.
USOUSD
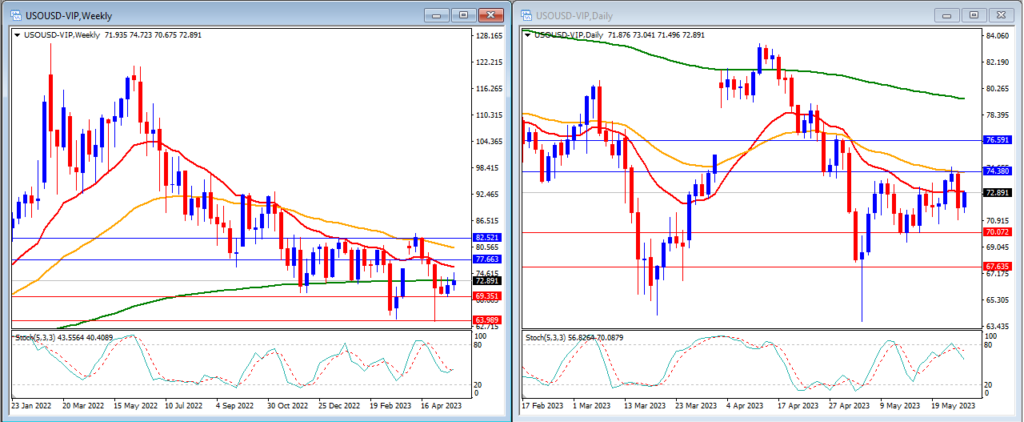
Last week, USOUSD (Oil) moved slowly but slightly higher, successfully surpassing our anticipated daily resistance level. USOUSD closed the week at 72.89.
On the weekly timeframe, we can observe that the Stochastic Indicator is moving lower within the mid-range. The price is currently moving below the 20, 50, and 200-period moving averages.
Our weekly resistance levels are at 77.66 and 82.52, with support levels at 69.35 and 63.98.
On the daily timeframe, the Stochastic Indicator is moving lower, just below the overbought region. The price is now moving below the 20, 50, and 200-period moving averages.
Our daily resistance levels are at 74.38 and 76.59, while support levels are at 70.07 and 67.63.
Conclusion: Although oil saw gains last week, the focus remains on US debt ceiling talks and the upcoming Jobs report. A slight downward movement may occur this week, potentially reaching above the 70.07 support level.
NAS100
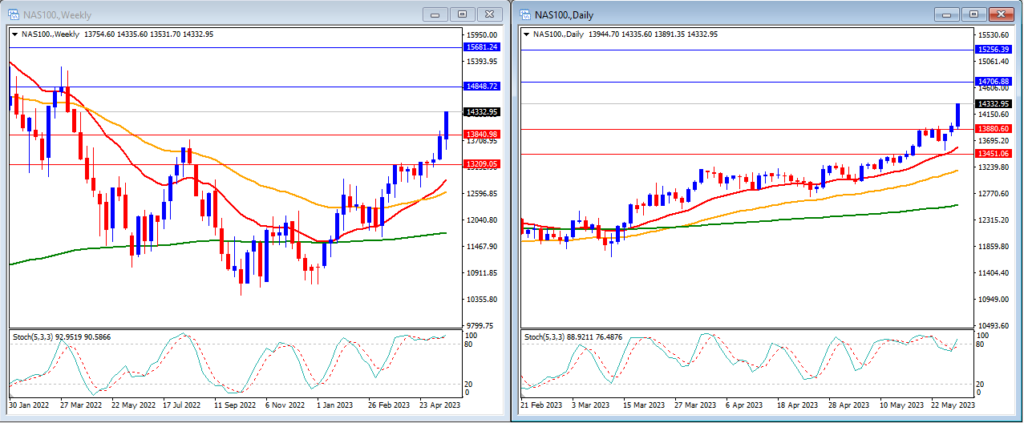
The NAS100 saw a considerable increase last week, driven by tech stock interest, breaking through resistance levels and closing at 14,332.
On the weekly timeframe, we can observe that the Stochastic Indicator is still within the overbought range. The price is currently moving above the 20, 50, and 200-period moving averages.
Our weekly resistance levels are at 14,848 and 15,681, with support levels at 13,840 and 13,209.
On the daily timeframe, the stochastic indicator is moving back into the overbought level. The price is now moving above the 20, 50, and 200-period moving averages.
Our daily resistance levels are currently at 14,706 and 15,256, while support levels are at 13,880 and 13,451.
Conclusion: Amid US debt ceiling discussions and the upcoming Jobs report, sudden stock market volatility is anticipated. The NAS100 may trend lower, potentially reaching the 13,880 support level. However, monitoring tech stock interest is crucial, as it could drive the NAS100 higher.
GBPUSD
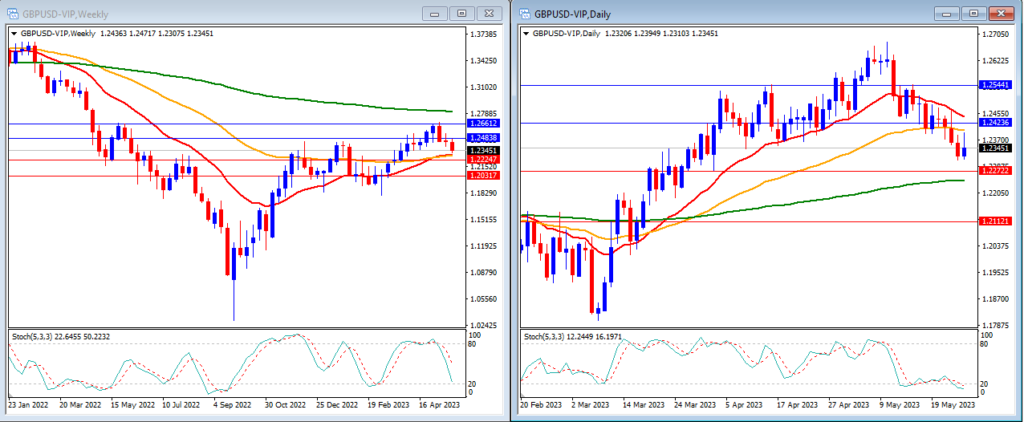
Last week, GBPUSD experienced a slight decline and successfully broke our first support levels. GBPUSD closed the week at 1.2345.
On the weekly timeframe, the Stochastic Indicator is showing strong downward movement after exiting the overbought zone. The price is currently moving above the 20 and 50-period moving averages, but below the 200-period moving average.
Our weekly resistance levels are at 1.2483 and 1.2661, while support levels are at 1.2224 and 1.2031.
On the daily timeframe, our stochastic indicator is moving lower, nearing the oversold level. The price is currently moving below the 20 and 50-period moving averages, but still above the 200-period moving average.
Our daily resistance levels are now at 1.2423 and 1.2544, while support levels are at 1.2272 and 1.2112.
Conclusion: The US Jobs report, a key market-moving event this week, will affect major currencies like GBPUSD. We expect a slight upward movement in GBPUSD, potentially reaching resistance levels around 1.2483.
USD Index
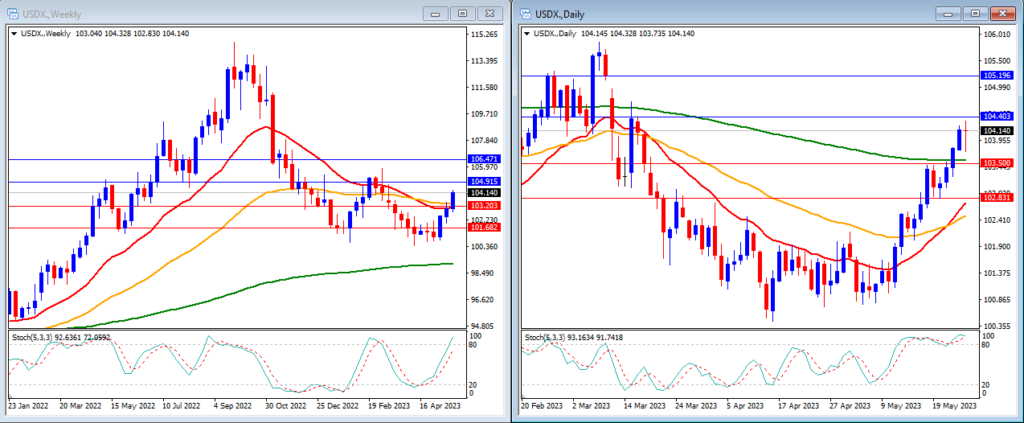
Last week, the USD Index received a boost and successfully broke our anticipated resistance level. The USD Index closed the week higher at 104.14.
On the weekly timeframe, we can observe that the Stochastic Indicator is showing strong upward movement, targeting the overbought region. The price is currently above the 20, 50, and 200-period moving averages.
Our weekly resistance levels are at 104.91 and 106.47, with support levels at 103.20 and 101.68.
On the daily timeframe, the Stochastic Indicator is within the overbought level. The price is now moving above the 20, 50, and 200-period moving averages.
Our daily resistance levels are 104.40 and 105.19, with support levels at 103.50 and 102.83.
Conclusion: Expect heightened volatility this week due to the US Jobs Reports, including JOLTS Job Report, ADP Non-Farm, Non-Farm Employment, and Unemployment rate. Additionally, US debt ceiling discussions will continue to impact the market. The USD Index could potentially rise further, reaching the 104.91 resistance level.
USDJPY
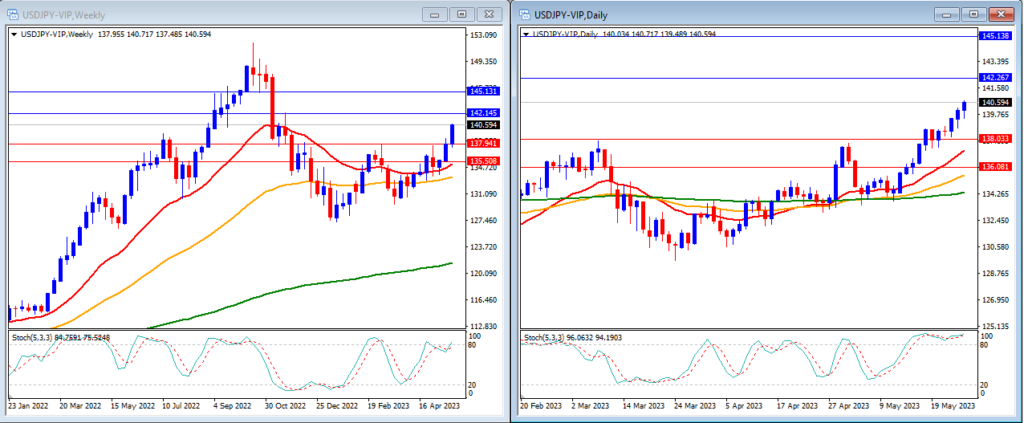
USDJPY moved higher last week, with the US Dollar strengthening and the Japanese Yen under pressure, breaking through the expected resistance level. USDJPY closed the week at 140.59.
On the weekly timeframe, we can observe that the Stochastic Indicator is moving higher, entering the overbought zone. The price is above the 20, 50, and 200-period moving averages.
Our weekly resistance levels are at 142.14 and 145.13, with support levels at 137.94 and 135.50.
On the daily timeframe, the stochastic indicator is still within the overbought range. The price is above the 20, 50, and 200-period moving averages.
Our daily resistance levels are currently at 142.26 and 145.13, while the support levels are at 138.03 and 136.08.
Conclusion: USDJPY is likely to be impacted by US Dollar events this week, with no major news releases from Japan. We expect USDJPY to continue rising, potentially reaching the 142.26 resistance level.