Spreads
Spreads
Spreads
Spreads
Spreads
Make informed decisions with the most up-to-date and reliable financial data, exclusively provided by vtmarkets.com.
EUR/USD (4 Hours)
EUR/USD Retreats as Stronger US Dollar and Hawkish Sentiment Drive Market Dynamics
On Tuesday, the EUR/USD briefly surpassed 1.0900 but retreated to 1.0855 due to a stronger US Dollar. The Dollar gained strength due to risk aversion, higher US yields, and hawkish comments from Federal Reserve officials, despite mixed US data. In Europe, the German ZEW Economic Sentiment index declined, while Eurozone Preliminary GDP data showed modest growth. The Euro was largely unaffected by these numbers. Market participants anticipate another rate hike in June, and upcoming releases include Eurostat’s final inflation for April and a speech by the European Central Bank’s De Guindos. In the US, Retail Sales and Industrial Production had mixed results. Fed officials’ remarks supported the Greenback, pushing US yields higher and impacting the EUR/USD exchange rate. At present, the US Dollar maintains its dominant position.
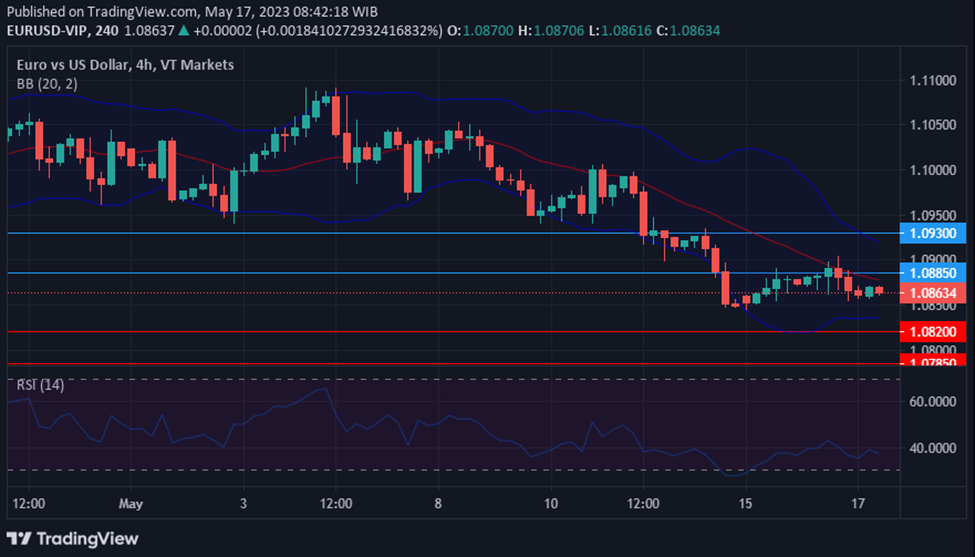
According to technical analysis, the EUR/USD pair is moving in consolidating mode and keep moving between the lower and middle band of the Bollinger band. It is anticipated that the EUR/USD will make a lower move and push the lower band and reach the support level. The Relative Strength Index (RSI) is currently at 38, indicating an overall bearish trend in the EUR/USD market.
Resistance: 1.0885, 1.0930
Support: 1.0820, 1.0785
XAU/USD (4 Hours)
Gold (XAU/USD) Drops Below $2,000 as US Dollar Strengthens on Retail Sales
On Tuesday, Spot Gold (XAU/USD)experienced a decline, falling below the $2,000 mark due to increased buying of the US Dollar by market participants following the release of several US economic data. While US Retail Sales in April showed a modest 0.4% monthly increase, it fell short of expectations.
However, there was some positive news as April Capacity Utilization met expectations and Industrial Production surpassed predictions with a 0.5% rise. Additionally, the NAHB Housing Market Index improved to 50 in May from its previous level of 45. These data outcomes affected the market sentiment negatively, leading to US indexes trading in the red and European indexes ending the session with modest losses. Furthermore, government bond yields surged, with the 10-year Treasury note yielding 3.56% (up 5 basis points) and the 2-year note offering 4.10% (up 10 bps) on the day.
The ongoing debt-ceiling negotiations between President Joe Biden and lawmakers also contributed to the cautious sentiment as investors awaited updates to avoid a default.
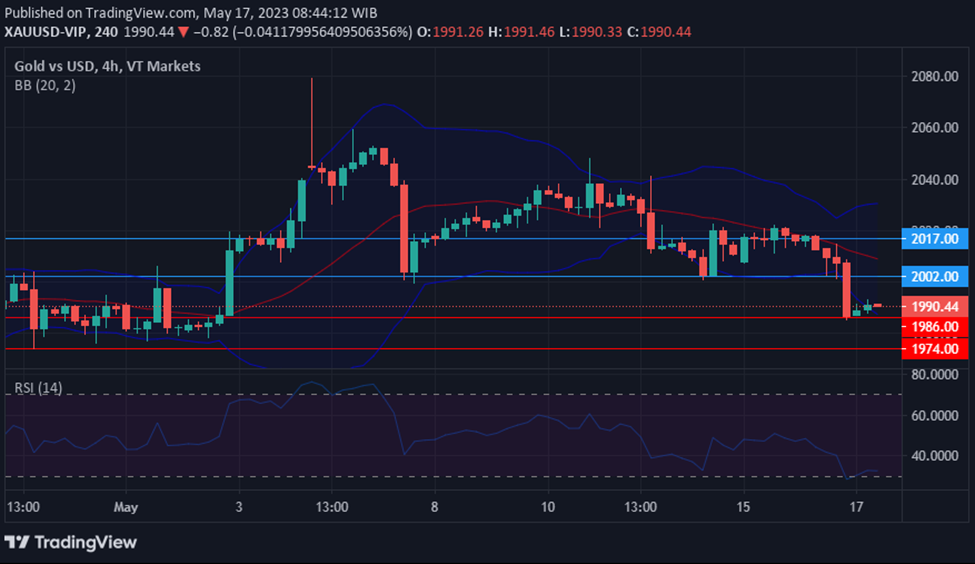
According to technical analysis, XAU/USD fell on Tuesday after some flat movement in the last few days, creating a push lower movement for the lower band of the Bollinger Band. There’s a possibility that XAU/USD might move higher to reach the middle band of the Bollinger band. Currently, the Relative Strength Index (RSI) stands at 34, indicating that XAU/USD is in the bearish mode.
Resistance: $2,002, $2,017
Support: $1,986, $1,974
Make informed decisions with the most up-to-date and reliable financial data, exclusively provided by vtmarkets.com.