Spreads
Spreads
Spreads
Spreads
Spreads
Gold (XAUUSD)
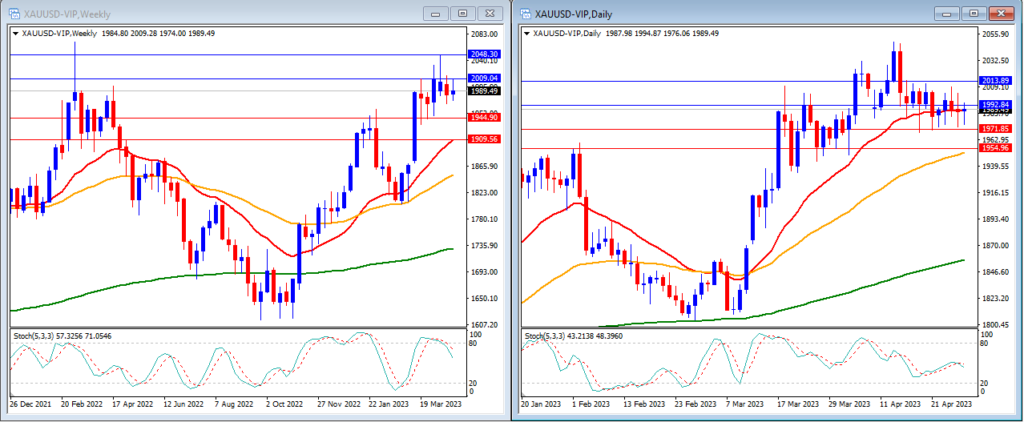
Last week, gold remained in consolidation and kept bouncing between our support and resistance levels. It managed to reach above the anticipated $2,000 mark, but unfortunately, it subsequently dropped back down. Gold concluded the week at a value of $1,989.
On the weekly timeframe, we can see that the Stochastic Indicator is exiting the overbought level. The gold price is currently moving above the 20, 50, and 200-period moving averages.
Our weekly resistance levels are at $2,009 and $2,048 with the support levels at $1,944 and $1,909.
Meanwhile, on the daily timeframe, the Stochastic Indicator moves in the middle. The price is still moving at the 20-period but still above the 50, and 200-period moving averages.
Our daily resistance levels are at $1,992 and $2,013, with the support levels at $1,971 and $1,954.
Conclusion: This week, the US will release critical news that may significantly impact the economy, such as the Fed Funds Rate and Non-Farm Employment Change. We anticipate that these may cause gold to move lower, possibly hitting our projected support level of $1,971.
EURUSD
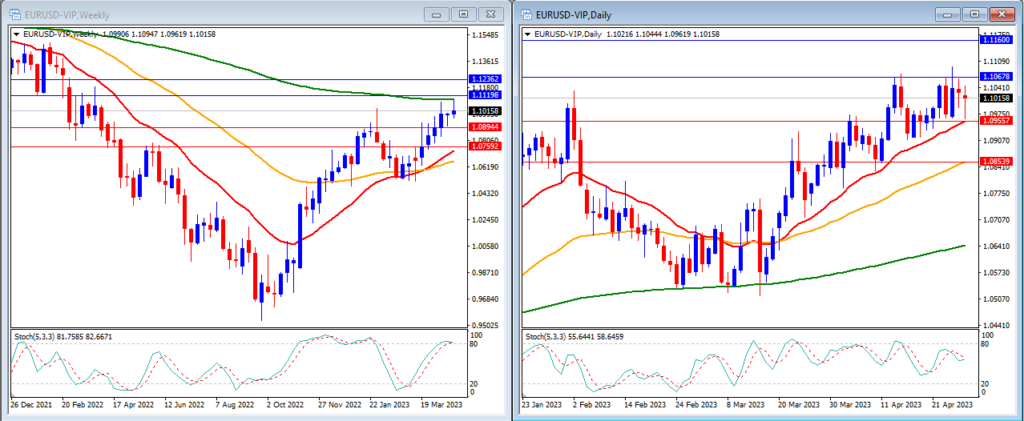
Last week, the EURUSD was able to move higher and reached our anticipated resistance level at 1.1067. As expected, the currency pair experienced a drop, and it concluded the week at a value of 1.1015.
On the weekly timeframe, the Stochastic Indicator is moving higher entering the overbought level. The price is still trading below the 200-period moving average, but above the 20 and 50-period moving averages.
Our weekly resistance levels are at 1.1119 and 1.1236, with support levels at 1.0894 and 1.0759.
On the daily timeframe, the Stochastic Indicator is moving in the middle. The price is now moving above the 20, 50 and 200-period moving averages.
Our daily resistance levels are at 1.1067 and 1.1160, while the support levels are at 1.0955 and 1.0853.
Conclusion: This week is expected to be significant for the market as the European Central Bank (ECB) will announce its interest rates, and the Federal Reserve will decide on its funds rate. In addition to this, the end of the week will also see the release of the US Non-Farm Employment Change. We anticipate the EURUSD to experience high volatility throughout the week and may dropw below the $1,1000 level.
DJ30
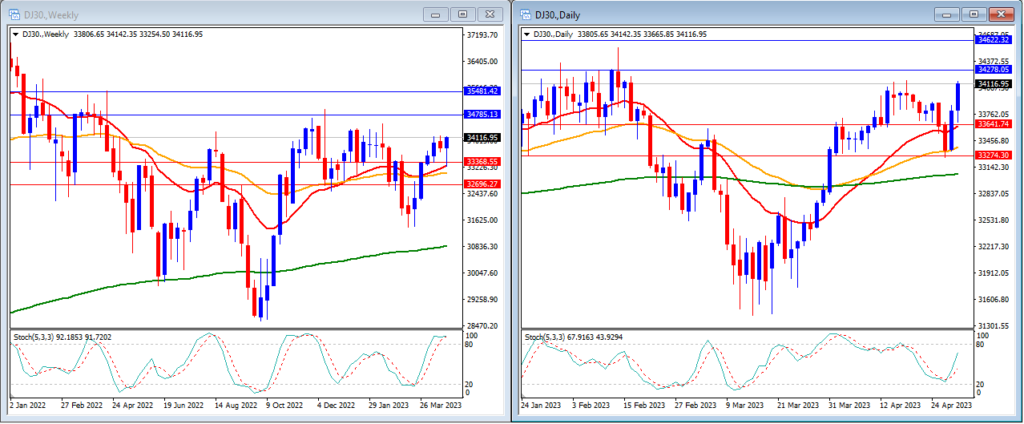
Last week, the DJ30 moved higher as expected, mostly affected by some big tech companies’ better-than-expected earnings reports. The DJ30 closed the week higher at 34116.
On the weekly timeframe, we can see that the Stochastic Indicator is moving inside the overbought level. The price is now moving above the 20, 50 and 200-period moving averages.
Our weekly resistance levels are at 34785 and 35481, with support levels at 33368 and 32696.
In the daily timeframe, we can see that the stochastic indicator is moving higher in the middle. The price is now moving ABOVE the 20, 50 and 200-period moving averages.
Our daily resistance levels are at 34278 and 34622, with support levels at 33641 and 33274.
Conclusion: As we head into another week of the earnings season, we are also looking forward to the announcement of the Fed’s funds rate decision and US jobs reports. These events are set to create high volatility in the market, particularly for the DJ30. We anticipate that the index will hit our projected resistance level at 34622.
USOUSD
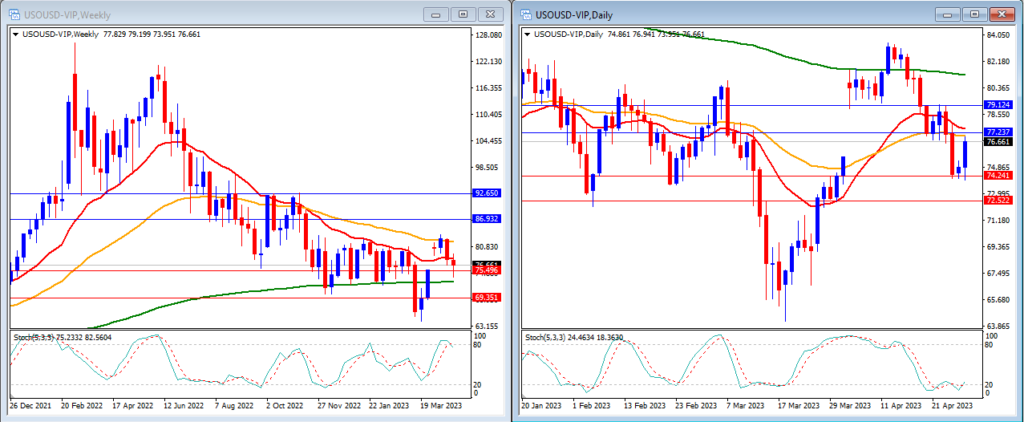
Last week, USOUSD (Oil) continued to move lower and was able to break our support levels as expected. USOUSD closed the week at 76.66.
On the weekly timeframe, the Stochastic Indicator is crossing back lower but still inside the overbought level. The price is moving just below the 20-period, below the 50-period and above the 200-period moving averages.
Our weekly resistance levels are 86.93 and 92.65, with support levels at 75.49 and 69.35.
On the daily timeframe, the Stochastic Indicator is moving flat inside the oversold level. Price is now moving below the 20, 50 and 200-period moving averages.
Our daily resistance levels are at 77.23 and 79.12, while support levels are at 74.24 and 72.52.
Conclusion: Oil supply remains high despite Russia’s planned cut. Additionally, economic uncertainty in China’s oil demand is weighing down USOUSD. This could result in a slight decrease in value, reaching our projected support level of 75.
NAS100
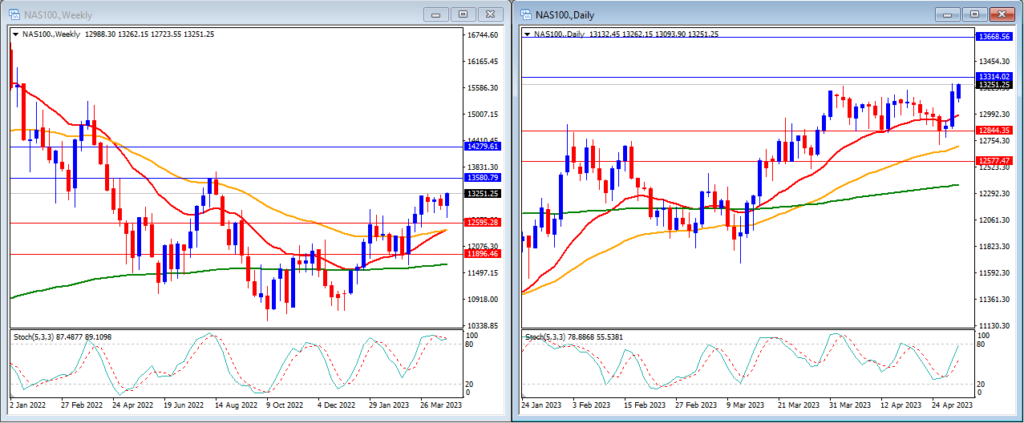
Last week, the NAS100 moved higher as expected, mostly affected by some big tech companies’ better-than-expected earnings reports. The NAS100 closed the week higher at 13251.
On the weekly timeframe, we can see that the Stochastic Indicator is moving inside the overbought level. The price is now moving above the 20, 50 and 200-period moving averages.
Our weekly resistance levels are at 13580 and 14279, with support levels at 12595 and 11896.
In the daily timeframe, we can see that the stochastic indicator is moving higher targeting the overbought level. The price is now moving ABOVE the 20, 50 and 200-period moving averages.
Our daily resistance levels are currently at 13314 and 13668, while support levels are at 12844 and 12577.
Conclusion: The upcoming announcement of the Federal Reserve’s funds rate decision and the release of the US jobs report are expected to cause high volatility in the market, particularly concerning the NAS100. We predict that the index may hit our resistance level at 13580.
GBPUSD
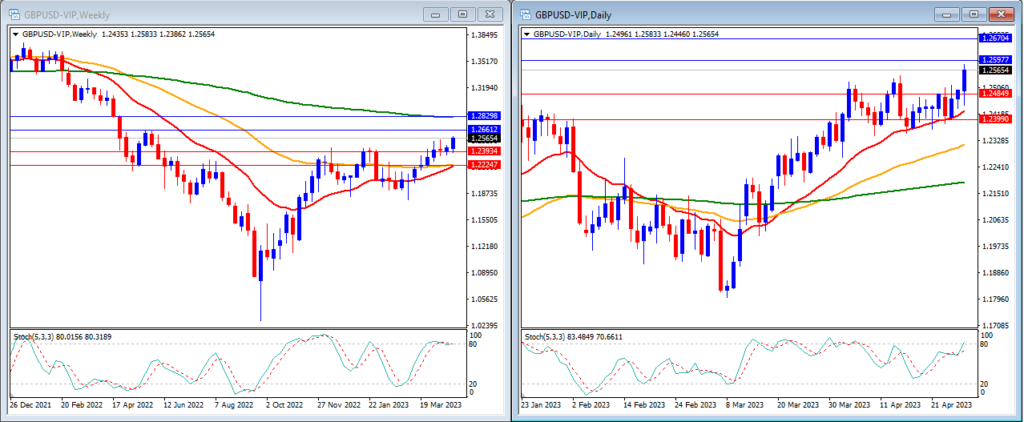
Last week, GBPUSD moved higher and was able to break our resistance levels. GBPUSD close the week at 1.2565.
On the weekly timeframe, the Stochastic Indicator is moving on the edge of the overbought level. The price is moving above the 20 and 50-period moving averages and below the 200-period moving average.
Our weekly resistance levels are at 1.2661 and 1.2829, while support levels are at 1.2393 and 1.2224.
On the daily timeframe, our stochastic indicator is moving higher targeting the overbought level. The price is still above the 20, 50, and 200-period moving averages.
Our daily resistance levels are now at 1.2597 and 1.2670, while support levels are at 1.2484 and 1.2399.
Conclusion: The market is eagerly waiting for the upcoming Fed Funds Rate decision and US Non-Farm Employment change this week. Our analysis suggests that GBPUSD may move lower and aim to reach below the 1.2400 level.
USD Index
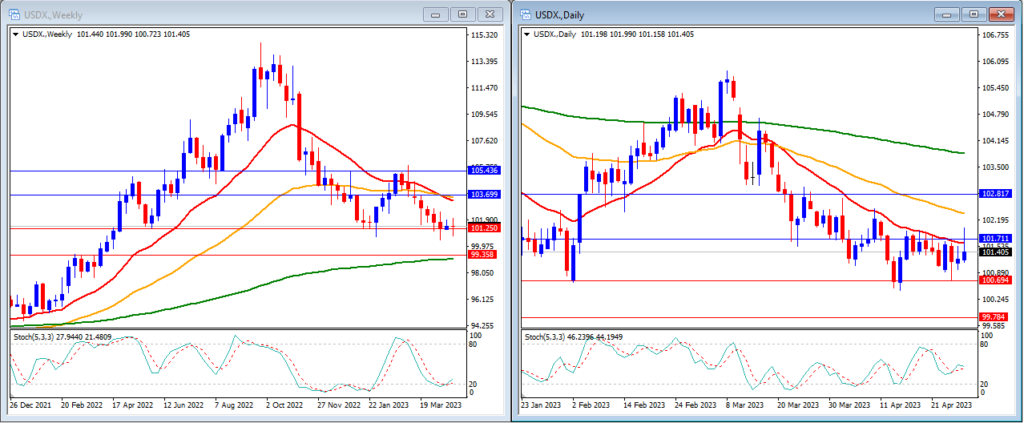
Throughout last week’s erratic economic data, the USD Index remained stable. Thanks to a boost from positive economic news towards the end of the week, the USD Index closed at 101.4.
On the weekly timeframe, we can see that the Stochastic Indicator is entering the oversold level and prepared to exit. Price is moving BELOW the 20 and 50-period moving averages but still above the 200-period moving average.
Our weekly resistance levels are at 103.69 and 105.43 with the support levels at 101.25 and 99.35.
On the daily timeframe, the Stochastic Indicator is moving lower in the middle. Price is now moving below the 20, 50 and 200-period moving averages.
Our daily resistance levels are at 101.71 and 102.81 with the support levels at 100.69 and 99.78.
Conclusion: This week, we can expect a high level of volatility in the USD Index as the Fed announces its Funds rate decision and the US releases its Non-Farm Employment change data. Our analysis suggests that the USD Index may experience a boost and rise above our daily resistance level of 101.71.
USDJPY
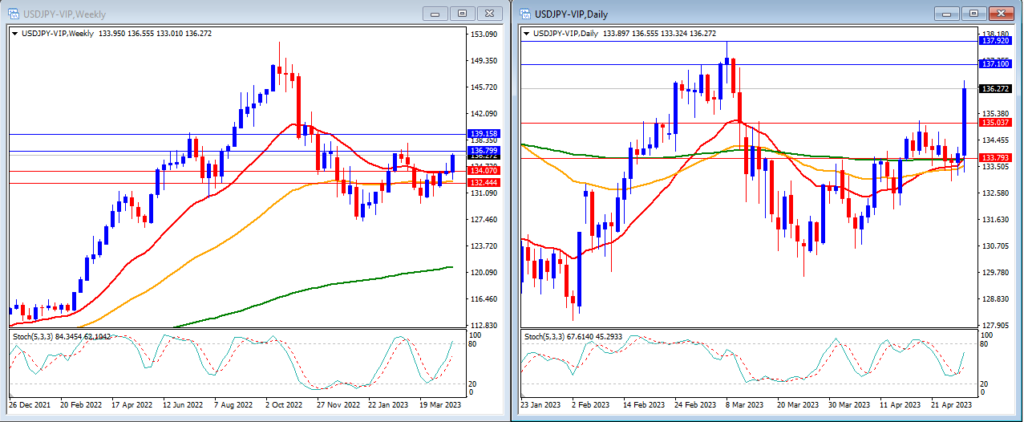
Last week, as expected, the weak JPY after the first BOJ meeting of Ueda allowed USDJPY to move higher and break our resistance level at 134.23. At the end of the week, the pair reached 136.27.
On the weekly timeframe, we can see that the Stochastic Indicator is strongly higher targeting the overbought level. The price is moving above the 20, 50 and 200-period moving average.
Our weekly resistance levels are 136.79 and 139.15, with the support levels at 134.07 and 132.44.
On the daily timeframe, the stochastic indicator is moving higher around near the oversold level. Price is moving above the 20, 50 and 200-period moving averages.
Our daily resistance levels are now at 137.10 and 137.92, while the support levels are at 135.03 and 133.79.
Conclusion: The sentiment towards JPY is expected to remain weak this week, with USDJPY anticipated to continue its upward momentum and reach our resistance level at 137.92.
Make informed decisions with the most up-to-date and reliable financial data, exclusively provided by vtmarkets.com.