Spreads
Spreads
Spreads
Spreads
Spreads

Last week, gold had a big movement and was able to move higher than our resistance level at $2,033 as expected. Gold closed the week at $2,004.
On the weekly timeframe, we can see that the Stochastic Indicator is still inside the overbought level. The gold price is currently moving above the 20, 50, and 200-period moving averages.
Our weekly resistance levels are at $2,033 and $2,070 with the support levels at $1,988 and $1,944.
Meanwhile, on the daily timeframe, the Stochastic Indicator exited the overbought level. The price is still moving above the 20, 50, and 200-period moving averages.
Our daily resistance levels are at $2,021 and $2,040, with the support levels at $1,993 and $1,971.
Conclusion: This week, we anticipate a significant focus on international events, which may offer a favourable opportunity for Gold to gain a stronger foothold before its next surge. We predict that Gold may experience an initial dip early in the week, followed by a subsequent rise towards our resistance level of $2,033.

Last week, EURUSD was able to continue to move higher and break our resistance level at 1.0933 as expected. EURUSD closed the week at 1.0993.
On the weekly timeframe, the Stochastic Indicator is moving higher targeting the overbought level. The price is still trading below the 200-period moving average, but above the 20 and 50-period moving averages.
Our weekly resistance levels are at 1.1119 and 1.1236, with support levels at 1.0894 and 1.0759.
On the daily timeframe, the Stochastic Indicator is moving flat in the middle near the overbought level. The price is now moving above the 20, 50 and 200-period moving averages.
Our daily resistance levels are at 1.1067 and 1.1160, while the support levels are at 1.0955 and 1.0853.
Conclusion: This week, a series of PMI data releases from the EU are expected, which could potentially have a significant impact on the market. Our analysis suggests that EURUSD may rise and potentially reach our resistance level of 1.1119.
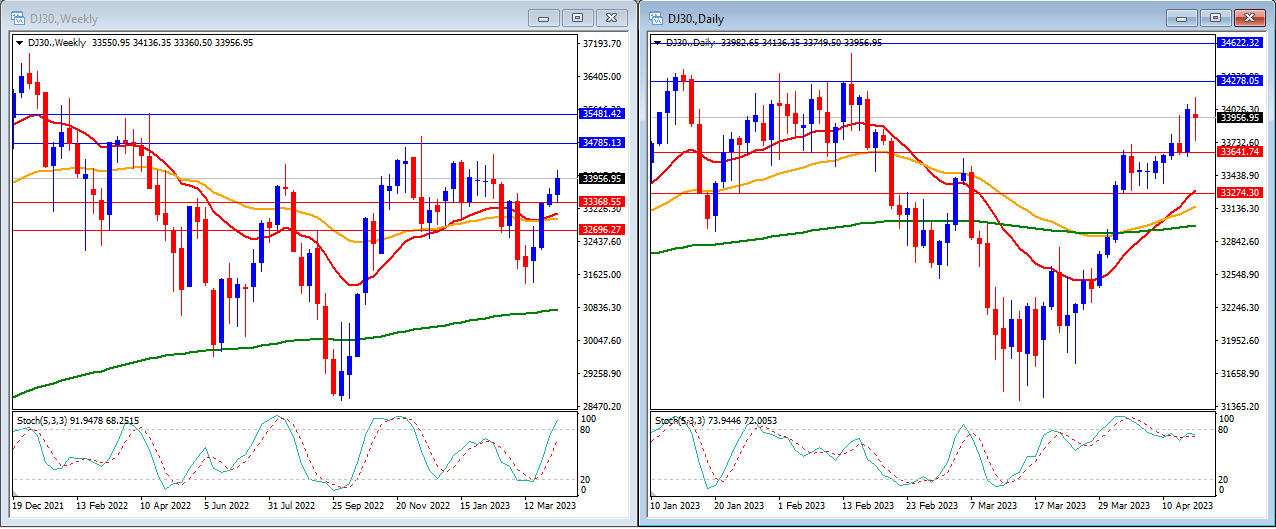
Last week, the DJ30 moved higher and was able to break our resistance level at 33776. The DJ30 closed the week higher at 33956.
On the weekly timeframe, we can see that the Stochastic Indicator is moving strongly higher targeting the overbought level. The price is now moving above the 20, 50 and 200-period moving averages.
Our weekly resistance levels are at 34785 and 35481, with support levels at 33368 and 32696.
In the daily timeframe, we can see that the stochastic indicator is moving flat near the overbought level. The price is now moving ABOVE the 20, 50 and 200-period moving averages.
Our daily resistance levels are at 34278 and 34622, with support levels at 33641 and 33274.
Conclusion: As the earning season begins, we anticipate that DJ30 will experience a boost, which may propel it to continue its upward trend towards our resistance level of 34785.

Last week, USOUSD (Oil) prices were able to break higher and able to break our resistance level at 81.50 as expected. USOUSD closes the week at 82.64.
On the weekly timeframe, the Stochastic Indicator is still in the middle with a strong higher movement. The price is moving just at the 50-period moving averages and above the 20 and 200-period moving averages.
Our weekly resistance levels are 86.93 and 92.65, with support levels at 75.49 and 69.35.
On the daily timeframe, the Stochastic Indicator is moving inside the overbought level. Price is now moving above the 20 and 50-period moving averages but still below the 200-period moving averages.
Our daily resistance levels are at 84.65 and 88.59, while support levels are at 81.62 and 77.43.
Conclusion: OPEC+ recently announced deep output cuts, which prompted a warning from the International Energy Agency (IEA) that such measures could potentially worsen the oil supply deficit and negatively impact consumers. As a result, we anticipate that there may be significant movement in USOUSD, and we predict that it may continue its upward trajectory towards our resistance level of 84.65.
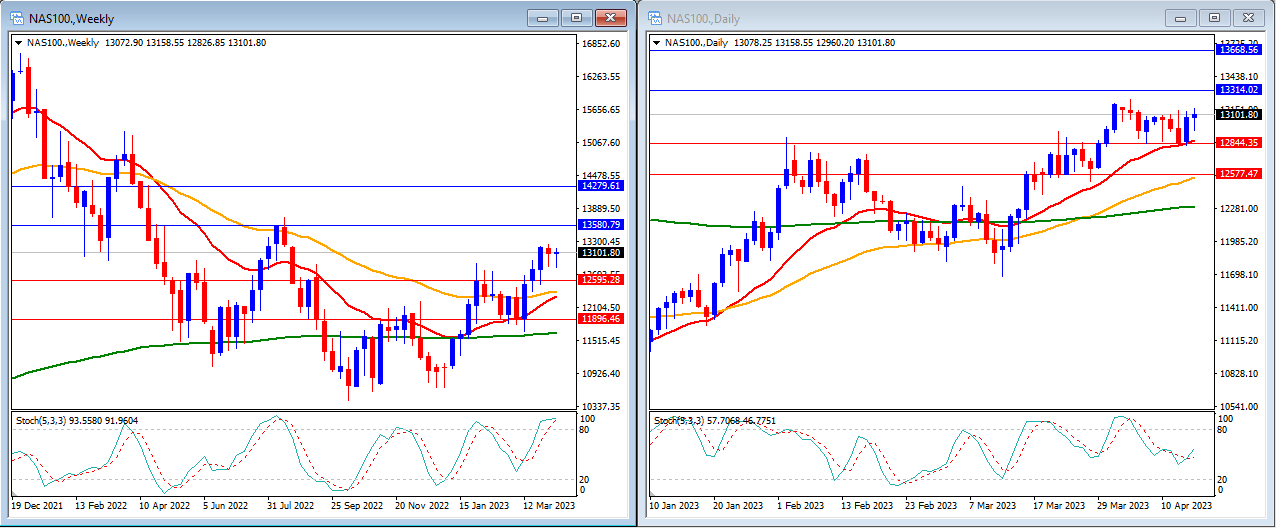
Last week, the NAS100 moved in flat but was able to reach our support level at 12844 as expected. The NAS100 closed the market at 13101.
On the weekly timeframe, the Stochastic Indicator is moving inside the overbought level. The price is currently above the 20, 50 and 200-period moving averages.
Our weekly resistance levels are at 13580 and 14279, with support levels at 12595 and 11896.
On the daily timeframe, the stochastic indicator is crossing back higher in the middle. The price is still trading above the 20, 50, and 200-period moving averages.
Our daily resistance levels are currently at 13314 and 13668, while support levels are at 12844 and 12577.
Conclusion: With the earning season starting, we expect NAS100 to get a boost and move slightly higher to reach our resistance level at 13314.
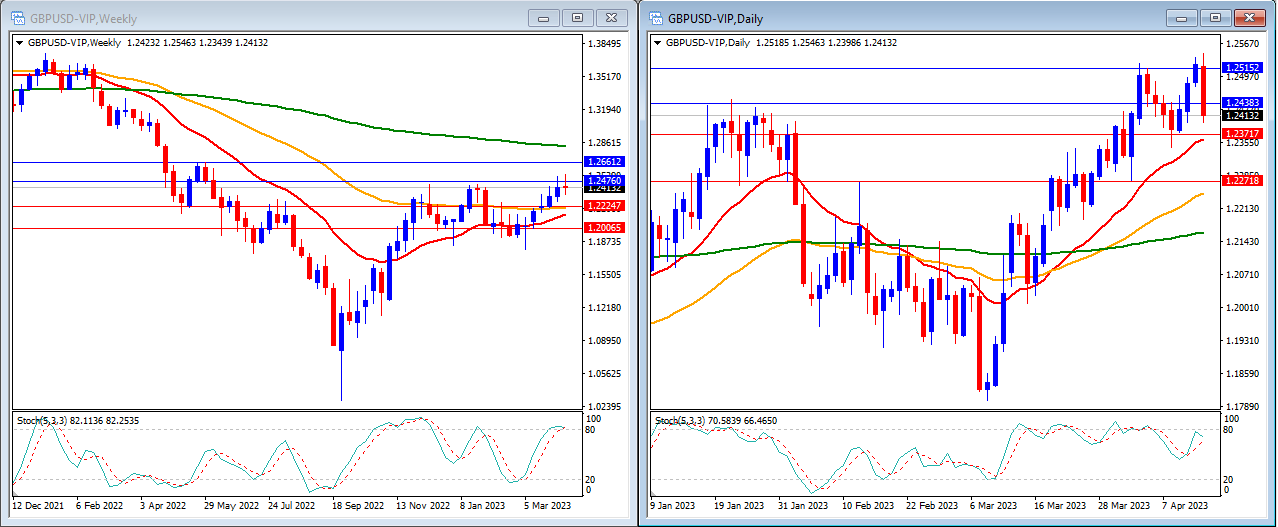
Last week, GBPUSD was able to moves higher as expected and able to reach above our resistance level at 1.2438 level but then close the week lower. GBPUSD close the week at 1.2413.
On the weekly timeframe, the Stochastic Indicator is moving inside the overbought level but there’s an indication that it will exit. The price is moving above the 20 and 50-period moving averages and below the 200-period moving average.
Our weekly resistance levels are at 1.2476 and 1.2661, while support levels are at 1.2224 and 1.2006.
On the daily timeframe, our stochastic indicator is moving higher near the overbought level. The price is still above the 20, 50, and 200-period moving averages.
Our daily resistance levels are now at 1.2438 and 1.2515, while support levels are at 1.2371 and 1.2271.
Conclusion: This week, the release of UK CPI and PMI data could potentially have a significant impact on GBPUSD. Our analysis suggests that GBPUSD may experience a downward trend, potentially reaching our support level of 1.2224.

Last week, USD Index continued to move lower due to slower US Inflation data. Markets now expect the Fed to keep the rate unchanged in the next meeting. The USD Index moved slightly lower and closed the week at 101.27 just above our support level.
On the weekly timeframe, we can see that the Stochastic Indicator is entering the oversold level. Price is moving BELOW the 20 and 50-period moving averages but still above the 200-period moving average.
Our weekly resistance levels are at 103.69 and 105.43 with the support levels at 101.25 and 99.35.
On the daily timeframe, the Stochastic Indicator is moving lower around the oversold level. Price is now moving below the 20, 50 and 200-period moving averages.
Our daily resistance levels are at 101.71 and 102.81 with the support levels at 100.69 and 99.78.
Conclusion: This week, the US PMI data release may be the key market influencer. There remains a general market expectation that the Fed will not raise interest rates during the upcoming meeting. Our analysis suggests that the USD Index may experience a slight decline, potentially falling below our support level of 101.25.
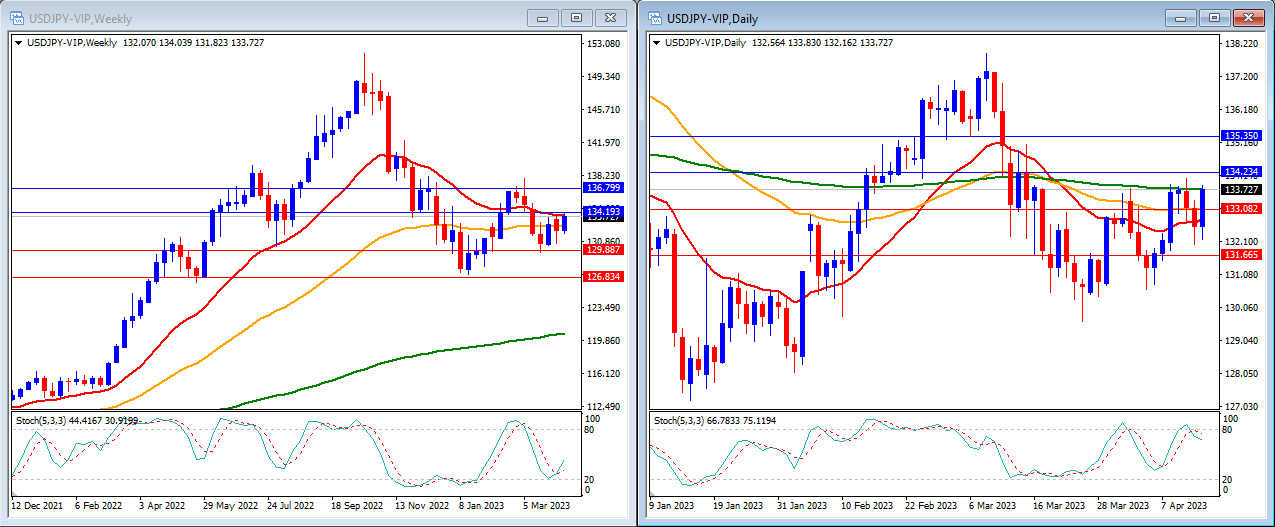
Last week, USDJPY was able to move higher and reach our resistance level at 133 as expected. USDJPY closes the week at 133.72.
On the weekly timeframe, we can see that the Stochastic Indicator is crossing back higher near the oversold level. The price is moving around the 20 and 50-period moving averages and still above the 200-period moving average.
Our weekly resistance levels are at 134.19 and 136.79, with the support levels at 129.88 and 126.83.
On the daily timeframe, the stochastic indicator is moving lower near the overbought level. Price is moving above the 20, 50 and at 200-period moving averages.
Our daily resistance levels are now at 134.23 and 135.35, while the support levels are at 133.08 and 131.66.
Conclusion: Our analysis indicates that the prevailing market sentiment remains unfavourable towards the USD this week. Consequently, we anticipate that USDJPY may continue to trend downwards, potentially falling below 133.
Make informed decisions with the most up-to-date and reliable financial data, exclusively provided by vtmarkets.com.