Spreads
Spreads
Spreads
Spreads
Spreads
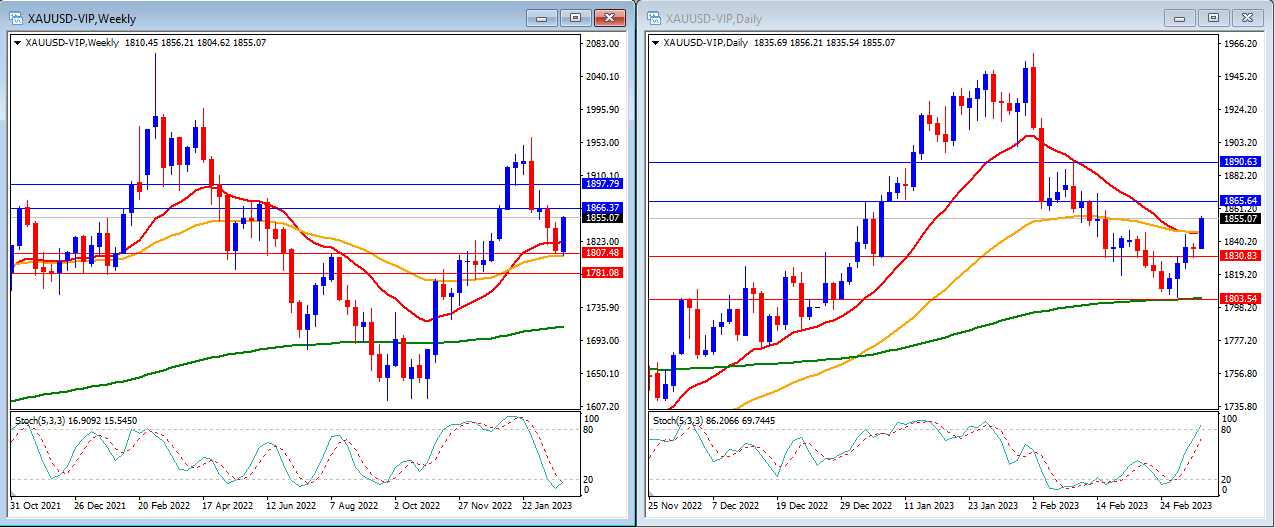
Gold increased last week as anticipated and managed to cross our resistance level at $1,854.Gold closed the week at $1,855.
We can see that the Stochastic Indicator is just inside the oversold level on the weekly timeframe and has the potential to cross back higher. Currently, the gold price is rising again and is above the 20, 50, and 200-period moving averages.
Our weekly resistance levels are at $1,866 and $1,897 with the support levels at $1,807 and $1,781.
Meanwhile, on the daily timeframe, the Stochastic Indicator is strengthening and approaching overbought territory. The price is now moving above the moving averages of 20, 50, and 200 periods.
Our daily resistance levels are at $1,865 and $1,890, with the support levels at $1,830 and $1,803.
Conclusion: This week, we will have a packed data release, as some central banks will release their interest rates, while the most awaited market mover is Non-farm Employment Change. For this week, we expect that gold may continue to move slightly higher to reach our resistance level of $1,890.
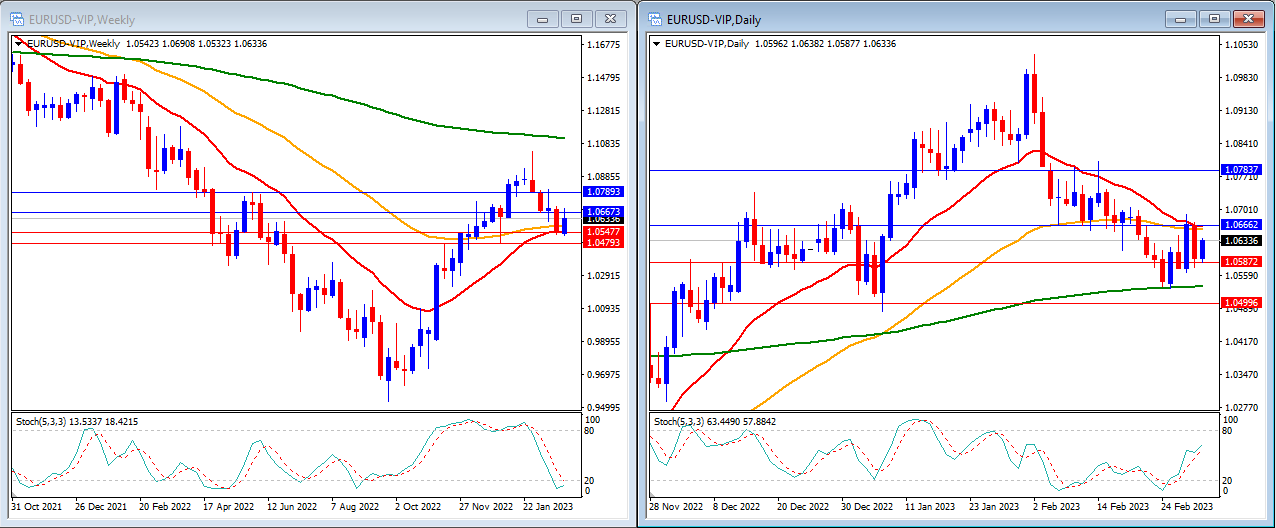
Last week, EURUSD was unable to move lower and was rejected by the 200-period moving average on the daily timeframe, closing the week slightly higher at 1.0633.
On the weekly timeframe, the Stochastic Indicator is strongly lower and targets the oversold level. The price is still trading below the 200-period moving average and hovering around the 20 and 50-period moving averages.
Our weekly resistance levels are at 1.0667 and 1.0789, with support levels at 1.0547 and 1.0479.
On the daily timeframe, the Stochastic Indicator is moving higher in the middle. The price is moving below the 20 and 50-period moving averages and above the 200-period moving average.
Our daily resistance levels are at 1.0666 and 1.0783, while the support levels are at 1.0587 and 1.0499.
Conclusion: The Non-Farm Payrolls report is the main market mover this week. We expect that EURUSD may move higher and attempt to break above our resistance level at 1.0667.
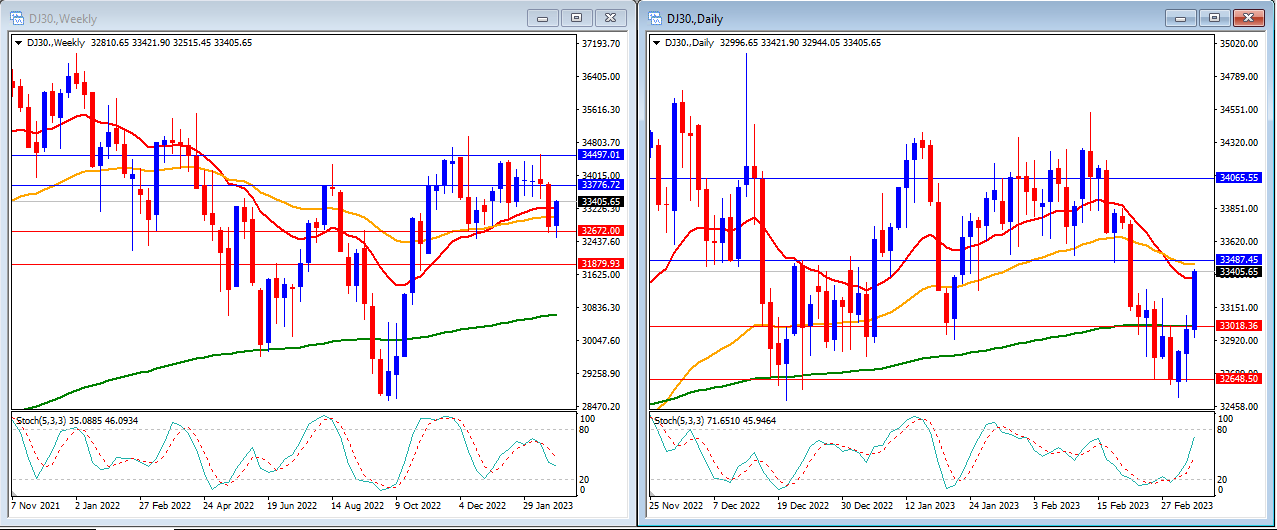
Last week, the DJ30 moved higher as investors weighed the Federal Reserve’s potential interest rate hikes to control inflation. The DJ30 closed the market at 33405.
On the weekly timeframe, we can see that the Stochastic Indicator is moving lower in the middle. The price is hovering around the 20 and 50-period moving averages but is still above the 200-period moving average.
Our weekly resistance levels are at 33776 and 34497, with support levels at 32672 and 31879.
In the daily timeframe, we can see that the stochastic indicator is moving higher, targeting the overbought level. The price is moving above the 20 and 200-period moving averages but is still below the 50-period moving average.
Our daily resistance levels are at 33487 and 34065, with support levels at 33018 and 32648.
Conclusion: With the US Non-Farm payrolls being released this week, we expect the DJ30 to move lower. We anticipate that the DJ30 may reach our support level at 33018.

Last week, USOUSD (Oil) prices were set for a weekly gain as Chinese demand rebounded and reached our expected resistance level. USOUSD closed the week at 79.75.
On the weekly timeframe, the Stochastic Indicator is still in the middle with no clear direction. The price is moving below the 20 and 50-period moving averages but above the 200-period moving average.
Our weekly resistance levels are at 78.77 and 82.42, with support levels at 73.40 and 69.60.
On the daily timeframe, the Stochastic Indicator is moving strongly higher targeting the overbought level. Price moves above the 20 and 50-period moving averages but is still below the 200-period moving average.
Our daily resistance levels are at 80.06 and 81.91, while support levels are at 77.66 and 75.25.
Conclusion: With higher demand for oil from China, we can expect USOUSD to continue to rise this week, targeting to reach above our resistance levels at 80.06.
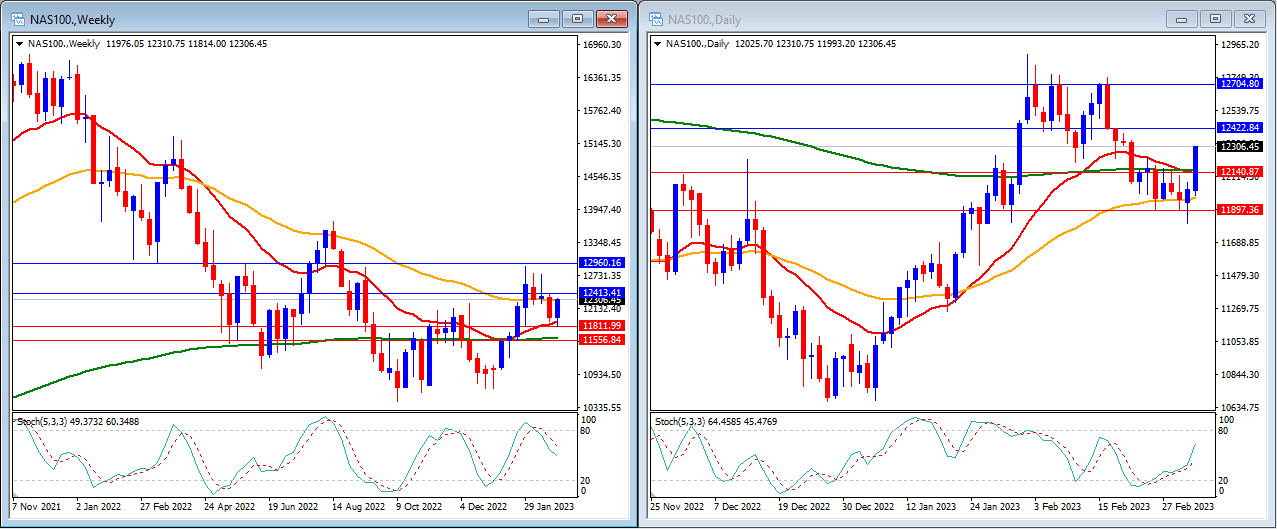
Last week, the NAS100 rose as investors considered the Federal Reserve’s potential interest rate hikes to curb inflation. The NAS100 closed the week at 12306.
On the weekly timeframe, the Stochastic Indicator is exiting the overbought level. The price is currently hovering around the 50-period moving average but remains above the 20 and 200-period moving averages.
Our weekly resistance levels are at 12413 and 12960, with support levels at 11811 and 11556.
On the daily timeframe, the stochastic indicator is moving higher in the middle. The price is now trading above the 20, 50, and 200-period moving averages.
Our daily resistance levels are currently at 12422 and 12704, while support levels are at 12140 and 11897.
In conclusion, with the release of the US Non-Farm payrolls this week, we expect the NAS100 to trend downwards. We anticipate that the NAS100 may reach our support level at 12140.
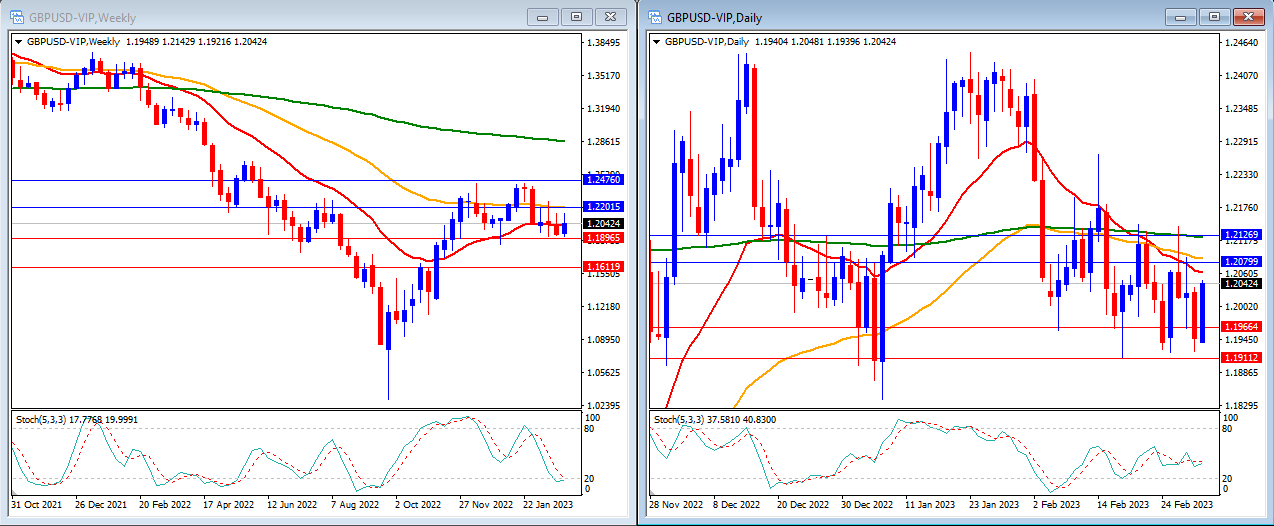
Last week, GBPUSD moved slightly lower and dipped below the 1.19 level before rebounding and closing the week higher at 1.2079.
On the weekly timeframe, the Stochastic Indicator is entering the oversold level, and the price is now below the 20, 50, and 200-period moving averages.
Our weekly resistance levels are at 1.2201 and 1.2476, while support levels are at 1.1896 and 1.1611.
On the daily timeframe, our stochastic indicator is still moving in the middle, and the price is below the 20, 50, and 200-period moving averages.
Our daily resistance levels are now at 1.2079 and 1.2126, while support levels are at 1.1966 and 1.1911.
Conclusion: With UK GDP and US Non-Farm Payroll data being released this week, we anticipate GBPUSD to move slightly higher and reach our resistance levels at 1.2126.
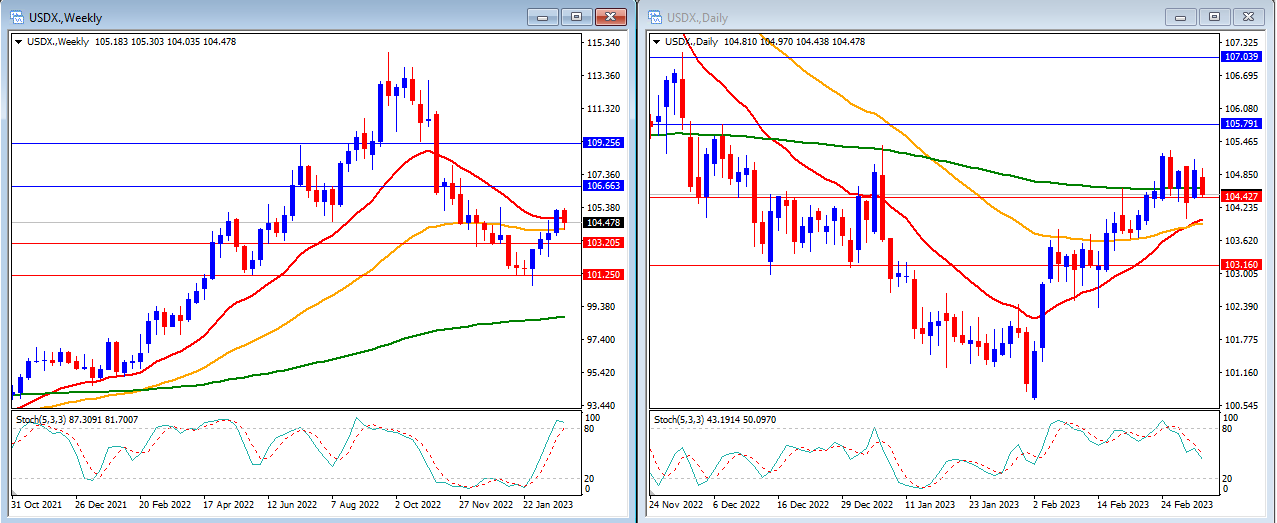
Last week, despite some mixed data being released, the USD Index moved slightly lower and closed the week at 104.47.
On the weekly timeframe, we can see that the Stochastic Indicator is entering the overbought level. Price is moving between the 20 and 50-period moving averages but still above the 200-period moving average.
Our weekly resistance levels are at 106.67 and 109.25 with the support levels at 103.20 and 101.25.
On the daily timeframe, the Stochastic Indicator is moving lower in the middle. Price is now moving above the 20 and 50-period moving averages but just below the 200-period moving average.
Our daily resistance levels are at 105.79 and 107.03 with the support levels at 104.42 and 103.16.
Conclusion: This week, the USD Index will likely experience volatility as the US Non-Farm Payroll report is set to be released. We anticipate that the USD Index might move higher to reach our resistance levels at 105.79 and 106.67.
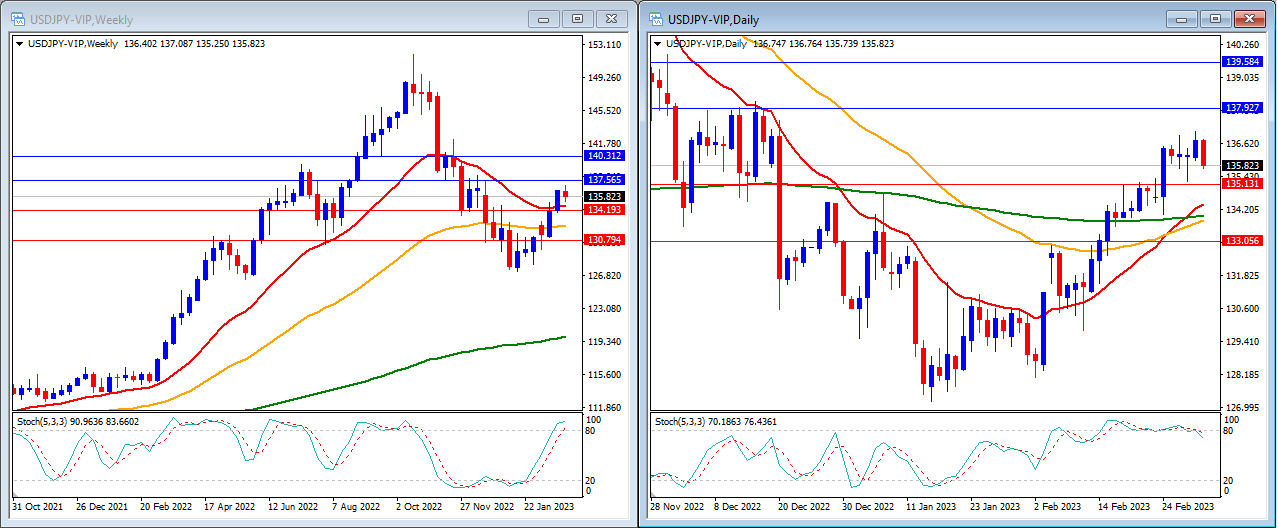
Last week, USDJPY moved slightly lower due to the weaker US data, closing the week at 108.52.
On the weekly timeframe, we can see that the Stochastic Indicator is now in the middle with no clear direction. The price is moving above the 20 and 50-period moving averages but below the 200-period moving average.
Our weekly resistance levels are at 109.59 and 111.26, with the support levels at 106.86 and 104.79.
On the daily timeframe, the stochastic indicator is moving slightly lower towards the oversold level. Price is moving below the 20, 50 and 200-period moving averages.
Our daily resistance levels are now at 108.79 and 109.39, while the support levels are at 107.89 and 107.22.
Conclusion: This week, the market will focus on the US FOMC meeting minutes and the US Retail Sales data, which may lead to increased volatility. Based on the current trend and indicators, we expect USDJPY to move slightly lower towards our support level at 107.89.
Make informed decisions with the most up-to-date and reliable financial data, exclusively provided by vtmarkets.com.