Spreads
Spreads
Spreads
Spreads
Spreads
EURUSD (4-Hour Chart)
EURUSD edged lower throughout Wednesday’s trading and could not extend the pair’s three-day winning streak. The Euro-Dollar pair witnessed large volatility at the start of the American trading session as the Dollar dipped before starting an impressive rally that altered the course of EURUSD. The renewed Dollar strength comes after U.S. equities continue to sell off as the year comes to a close. Market participants are looking for safety as both equities and bonds continue to lose ground since trading began after the holidays. The benchmark U.S. 10-year treasury yield is now trading above the 3.87% mark, while the 2-year treasury yield was last seen trading at 4.357%. Yield curve inversion, often seen during late-cycle economies, will continue to be the norm as global economies head into a grim 2023. The nature of late-cycle economies could favour the U.S. Greenback in 2023 as global market participants look to protect asset valuations.
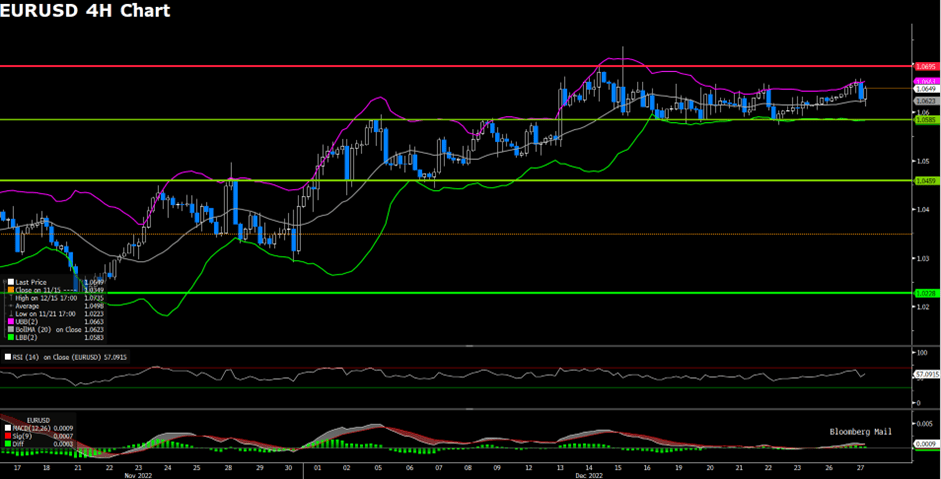
On the technical side, EURUSD has continued to trade below our previously estimated resistance level of 1.0695. Short-term support remains at 1.0585 and 1.04591. RSI for the pair sits at 61.97, as of writing. On the four-hour chart, EURUSD currently trades above its 50, 100, and 200-day SMA.
Resistance: 1.0695
Support: 1.0585, 1.0459
GBPUSD (4-Hour Chart)
The pound rose sharply after a choppy European session, rebounding from an intra-day low near $1.2000 to challenge the $1.2100 figure in the American session. China is lifting Covid-19 restrictions on tourists, while it has started issuing travel permits to Hong Kong residents. In addition, authorities are starting to issue passports and will officially reopen the border on Jan. 8. Even though sentiment has turned positive, concerns about rising inflationary pressures are keeping traders on their toes. the U.S. Dollar Index, which measures the value of the greenback against a basket of peers – was down 0.28% at 103.984, weighed down by lower yields on U.S. Treasuries. There are no particular market events by this week for the UK.
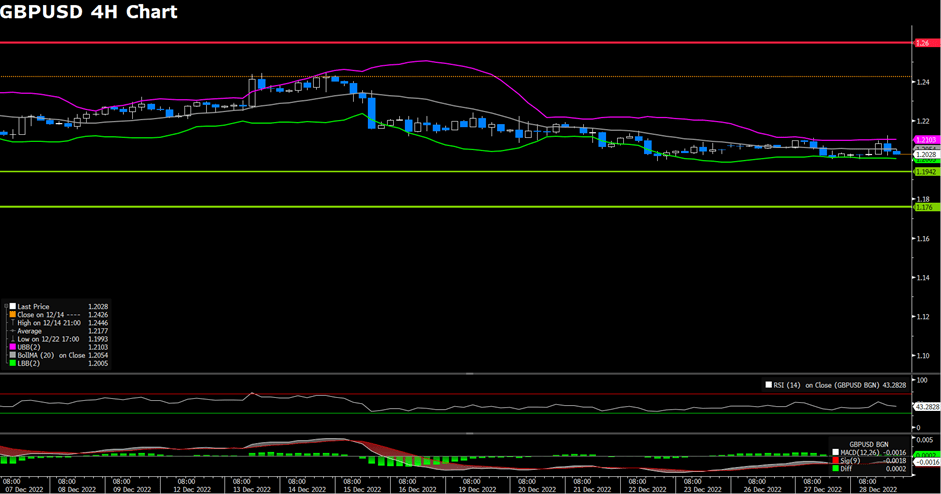
Looking at the daily chart, GBP/USD is testing the 20 and 200-day EMA at 1.2113 after bouncing off the weekly lows near 1.2000. If the former is cleared, nest resistance would be the previous support-transfer-resistance of the uptrend line near 1.2180, followed by the 1.2200 figure. Conversely, failure to stay above 1.2100 could pave the way towards the weekly low at 1.2000 and the 50-day EMA at 1.1935. RSI for the pair sits at 48.71, as of writing. On the four-hour chart, GBPUSD currently trades above its 50, 100 day SMA but above its 200-day SMA.
Resistance: 1.2320, 1.2600
Support: 1.19, 1.176
XAUUSD (4-Hour Chart)
XAUUSD gave back gains after surging higher on Tuesday and fell further on Wednesday, basically having spit out all gains so far. The prices edged lower by nearly 1% to the lowest price at $1,797 during the American trading session. It is hovering around $1,800 with bearish trends. As the price broke through the last estimated support of $1,812 and $1,800, it would make gold vulnerable to a decline to test an uptrend line around $1,795. A break below could trigger more losses, to the $1,785 zone. Below the next support is located at $1,773, which is Dec 15 & 16 low. As equity prices in Wall Street turned negative and amid a rebound in US yields to fresh daily highs, and the US Dollar Index rose from the lowest level in almost a week at 103.84 to 104.45, the strongest since Friday. The context put pressure on the gold price.
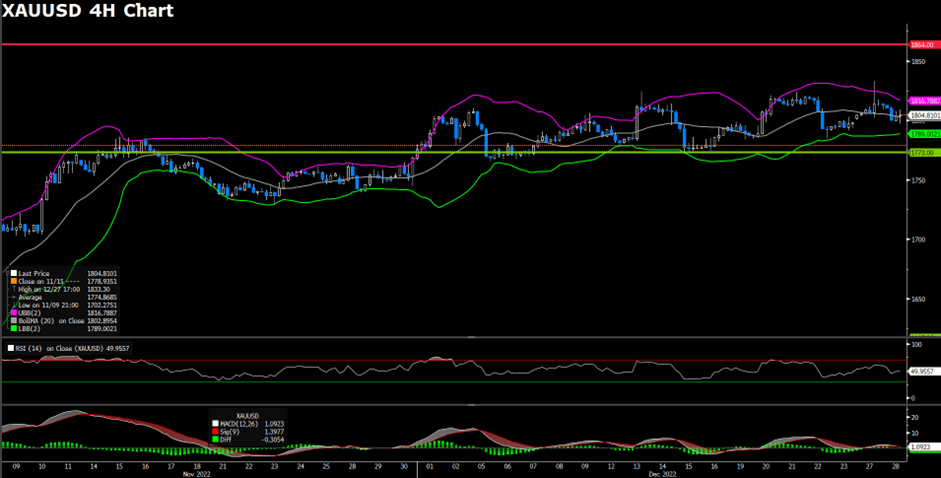
On the technical side, The four-hour chart shows that gold prices have slowed since mid-November, with the centre of gravity gradually rising, but the trend is gradually forming a rising wedge that warrants caution, as this is often a signal for a reversal to the downside. RSI sits at 57.47 as of writing. On the four-hour chart, gold price trades above its 50, 100, and 200-day SMA.
Resistance levels: 1805, 1820, 1830
Support levels: 1792, 1785, 1773