Spreads
0.05%
Spreads
0.02%
Spreads
0.05%
Spreads
0.04%
Spreads
0.74%

Last week’s movement mainly focused on the speech from the Federal Reserve Chairman, which was expected to modify monetary policy. The Federal Reserve Chairman confirmed that the Fed would moderate tightening but warned of inflation in his speech.
(All data taken from MT4 VT Markets)
(Picture taken from forexfactory.com)
Two central banks are expected to raise interest rates again this month.
Will the Reserve Bank of Australia and the Bank of Canada push through with another rate hike?
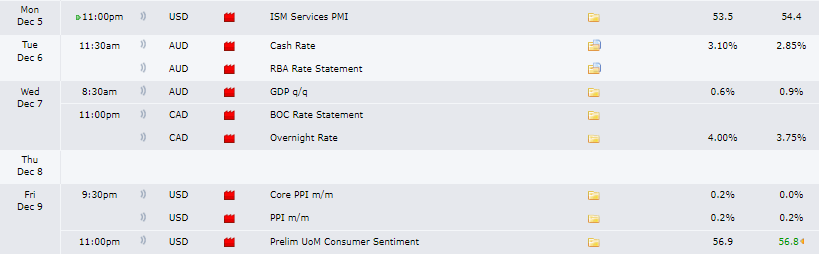
Here are the market events investors are keeping an eye on this week:
US ISM Services PMI | 5 December 2022
The US ISM Services PMI declined to 54.4 in October from 56.7 in September, missing market expectations of 55.5. This points to the slowest growth in the services sector since May 2020.
For November, analysts expect a much lower result of 53.9.
RBA Rate Statement | 6 December 2022
The Reserve Bank of Australia (RBA) increased the cash rate by 25bps to 2.85% in November, marking the seventh consecutive rate hike. The board mentioned that further rate hikes are necessary as inflation in Australia skyrocketed.
This month, analysts forecast another 25bps hike to 3.10%.
Australian Gross Domestic Products Q/Q | 7 December 2022
The Australian economy marked its third consecutive growth with Q2 GDP reading of 0.9%. While the first two quarters of 2022’s GDP reading show that the Australian economy remains afloat amidst global uncertainties, some analysts forecast that it is not completely out of the woods, as they may enter a recession by 2023 with a high unemployment rate forecasted at 4.5%.
For Q3, analysts expect Australia’s GDP to increase to 1.1%.
BOC Rate Statement | 7 December 2022
Bank of Canada (BoC) increased its overnight rate by 50bps to 3.75% in October, below market expectations that pointed to an aggressive 75bps hike. The latest rate hike pushes borrowing costs to its highest level since 2008, adding to the 350bps in interest rate increases over the current tightening cycle.
This month, analysts anticipate BoC to raise another 25bps to 4.00%.
US PPI | 9 December 2022
US PPI for final demand increased 0.2% month-on-month in October, the same as a downwardly revised 0.2% raise in September.
For November, analysts forecast US PPI to increase by another 0.3%.
US Prelim UoM Consumer Sentiment | 9 December 2022
The University of Michigan Consumer Sentiment for the US was revised higher to 56.8 in November from a preliminary reading of 54.7.
For December, analysts expect a lower consumer sentiment at 55.
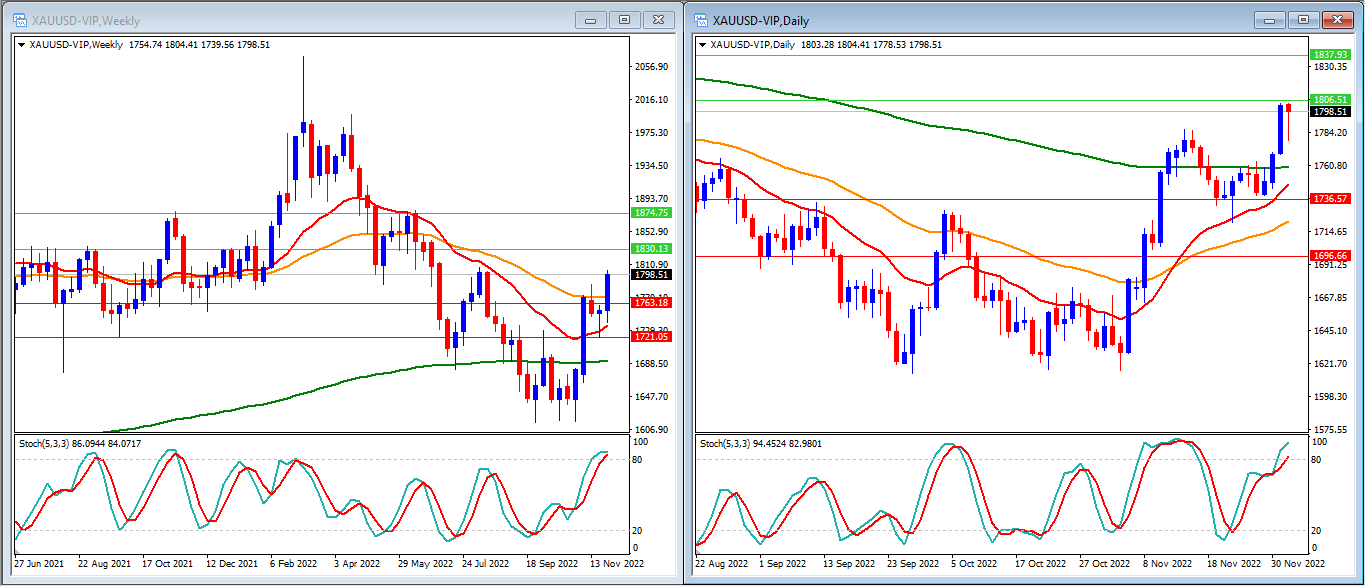
Last week, gold moved higher but could not reach our resistance level. Gold closes the week at $1,798.
On a weekly timeframe, we can see that the Stochastic Indicator shows a strong higher movement, entering the overbought level. Gold price is moving above the 20, 50 and 200-period moving averages.
Our Weekly resistance levels are at $1,830 and $1,874, with the support levels at $1,763 and $1,721.
Meanwhile, the Stochastic Indicator is moving higher on the daily timeframe entering the overbought level. Price is still moving above the 20, 50 and 200-period moving averages.
Our Daily resistance levels are at $1,806 and $1,837, with the support levels at $1,736 and $1,696.
Conclusion: We expect gold to move higher this week with a low US dollar sentiment. Gold might try to move higher to break our resistance levels at $1,806 and reach our weekly resistance level at $1,830.

Last week, EURUSD was unable to move lower as expected. Instead, it moved higher and closed the week at 1.0539.
The Stochastic Indicator is rising in the weekly timeframe entering the overbought level. The price continues to trade below the 200-period moving average and above the 20-period moving average while just able to break above the 50-period moving average.
Our Weekly resistance levels are at 1.0599 and 1.0780, with the support levels at 1.0360 and 1.0095.
On our daily timeframe, we can see that our stochastic indicator is moving higher. Price is moving above the 20, 50 and 200-period moving averages.
Our Daily resistance levels are now at 1.0614 and 1.0772, while the support levels are at 1.0486 and 1.0365.
Conclusion: The Federal Reserve Chairman confirmed that the Fed would moderate tightening but warned of inflation in his speech. We expect more volatility when the US PPI data is released this week. We expect the EURUSD to move higher to reach our resistance levels at 1.0599 (Weekly) and 1.0614 (Daily).

Last week, we expected that DJ30 would move lower to reach our support levels but could not. DJ30 moved a little bit higher, boosted by the Fed sentiment.
On the Weekly timeframe, we can see that the Stochastic Indicator is inside the overbought level and trying to cross. The price is now above all the 20, 50 and 200-period moving averages.
Our Weekly resistance levels are now at 34785 and 35627, with the support levels at 33588 and 32611.
On our daily timeframe, we can see that our stochastic indicator is moving higher in the mid-level. The price is moving above the 20, 50 and 200-period moving averages.
Our Daily resistance levels are now at 34796 and 35338, while the support levels are at 33476 and 32500.
Conclusion: With the sentiment surrounding the Fed decision, we can expect DJ30 to go higher to reach our resistance levels at 34785 (weekly) and 34796 (daily).
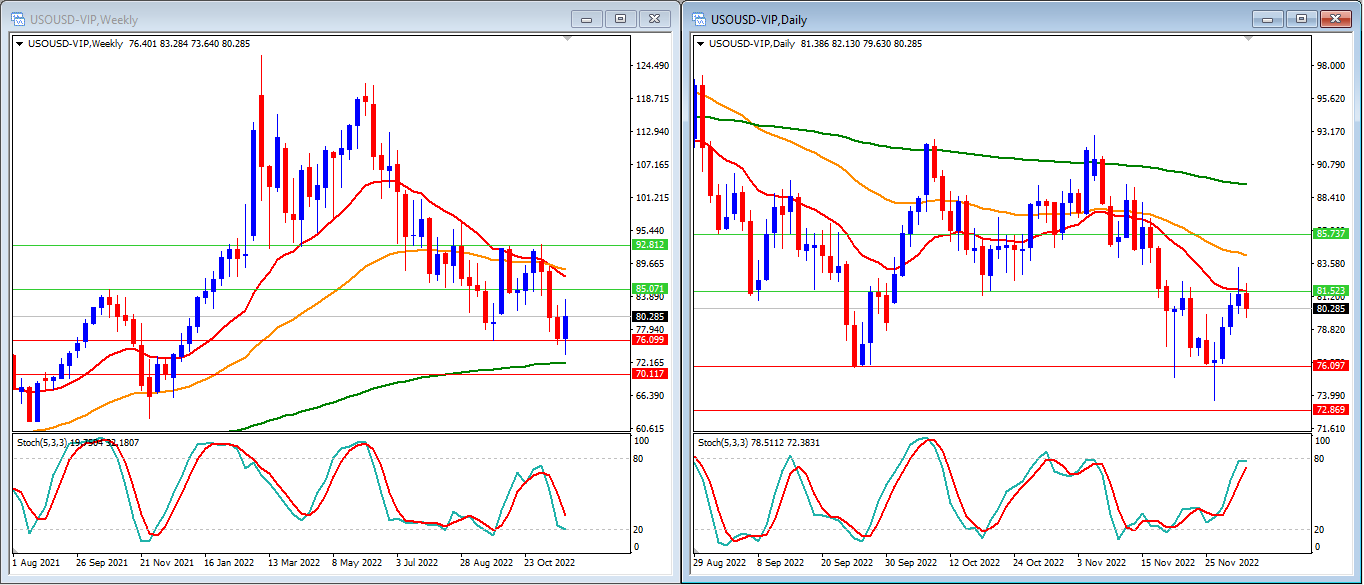
Last week, we expected the USOUSD to move lower and was able to do so on the first day of the week. It moved back higher later in the week to reach our resistance level and closed the week stronger at 80.28.
On the Weekly timeframe, we see that the Stochastic Indicator is moving lower, with the price moving below the 20 and 50-period moving averages while still above the 200-period moving average.
Our Weekly resistance levels are at 85.07 and 92.81, with the support levels at 76.09 and 70.11.
Our daily timeframe shows that our stochastic indicator is moving near the overbought level while the price moves below the 20, 50, and 200-period moving averages.
Our Daily resistance levels are 81.52 and 85.73, while the support levels are 76.09 and 72.86.
Conclusion: With the OPEC meeting this Sunday, we expect USOUSD to move lower if the board decides to add more supply. We expect the USOUSD to move lower to reach our daily support at 76.09.
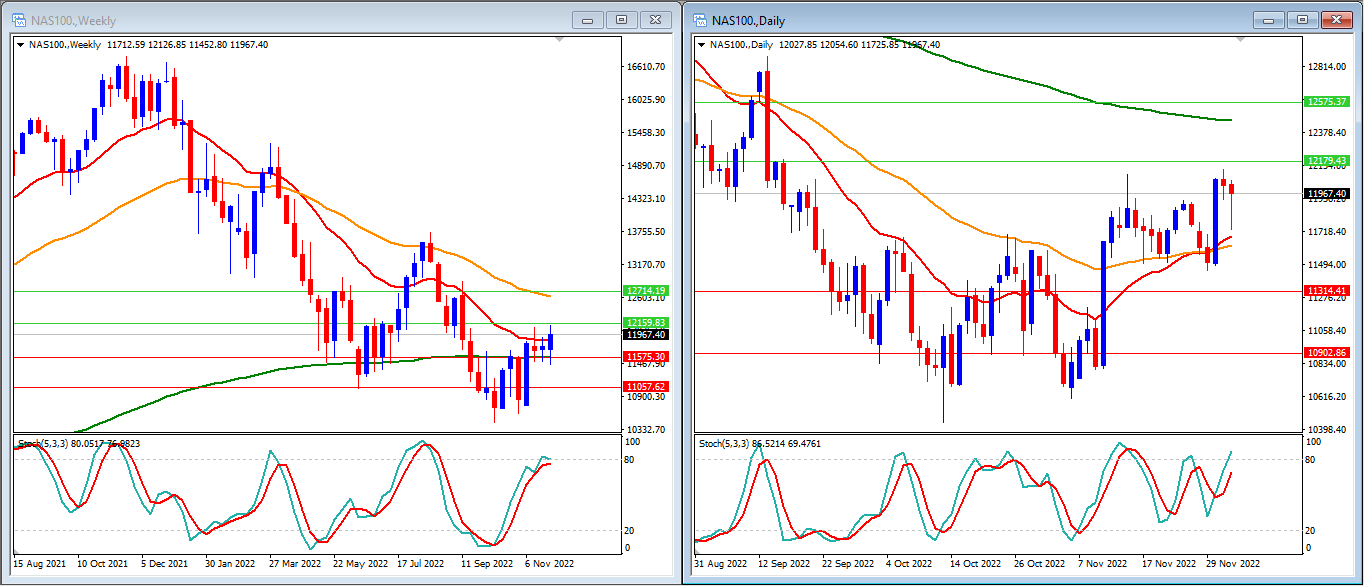
Last week, we expected NAS100 to move lower but could not. NAS100 moved between our weekly support and resistance levels and closed the week at 11967.
On the Weekly timeframe, we can see that the Stochastic Indicator is moving higher near the overbought level. The price is still moving below the 50-period moving average, breaking above the 20-period moving average, and still above the 200- period moving average.
Our Weekly resistance levels are at 12159 and 12714 (50-period moving average), with the support levels at 11575 and 11057.
On our daily timeframe, we can see that our stochastic indicator moves higher. Price is still moving above the 20 and 50-period moving averages but way below the 200-period moving average.
Our Daily resistance levels are at 12179 and 12575, while the support levels are at 11314 and 10902.
Conclusion: With the sentiment surrounding the Fed decision, we can expect that NAS100 will go higher and reach our resistance levels at 12159 (weekly) and 12179 (daily).
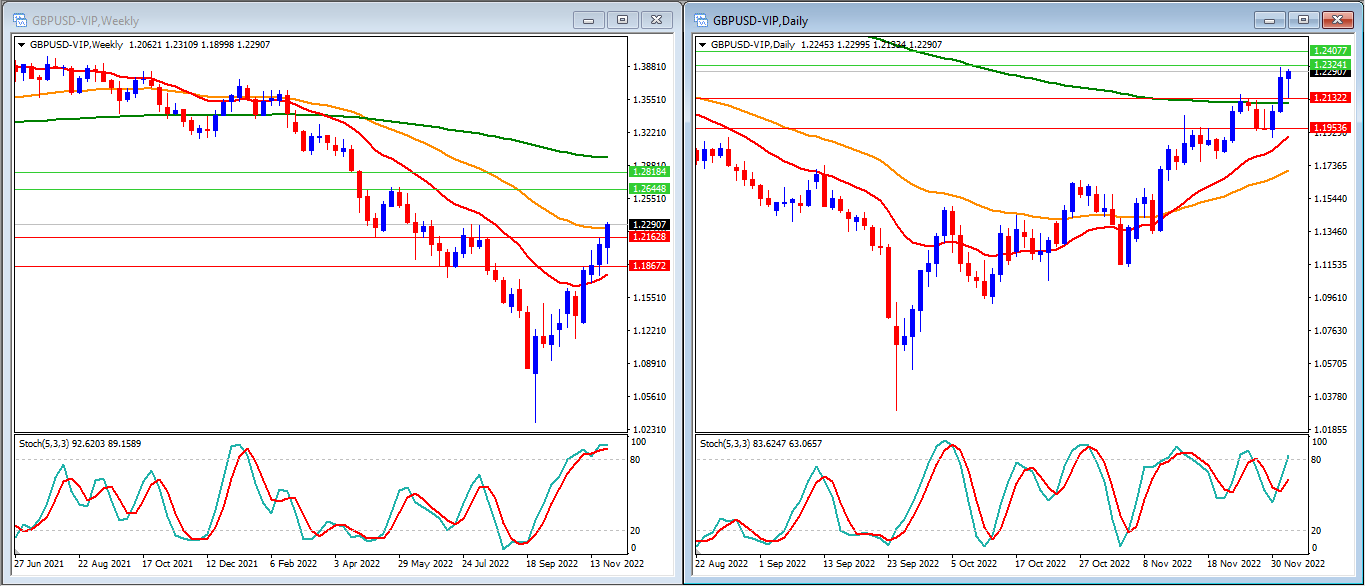
Last week, we expected the GBPUSD to move lower to reach our support level and was able to do so, but then GBPUSD moved higher and closed the week at 1.2290.
On the Weekly timeframe, we can see that the Stochastic Indicator is inside the overbought level and not showing any signs of crossing lower. The price still moves above the 20-period and 200-period moving averages but is just able to reach and try to break above the 50-period moving average.
Our Weekly resistance levels are at 1.2644 and 1.2818, with the support levels at 1.2162 and 1.1867.
Our stochastic indicator is moving higher on the daily timeframe, trying to reach the overbought level. Price is moving above the 20, 50, and 200-period moving averages.
Our Daily resistance levels are now at 1.2324 and 1.2407, while the support levels are at 1.2132 and 1.1953.
Conclusion: The Federal Reserve Chairman confirmed that the Fed would moderate tightening but warned of inflation in his speech. We expect more volatility when the US PPI data is released this week. We expect GBPUSD to move higher, at least to touch our daily resistance level at 1.2132.

Last week, the Federal Reserve Chairman confirmed that the Fed would moderate tightening but warned of inflation in his speech. USD Index continued to move lower and broke our support levels at 104.50, closing the week at 104.42.
On the Weekly Time Frame, we see that the Stochastic Indicator is moving lower, entering the oversold level. Price is moving below the 20-period moving average but still above the 50 and 200-period moving averages.
Our Weekly resistance levels are at 105.45 and 107.94, with the support levels at 103.64 and 101.62.
Meanwhile, on the daily timeframe, the Stochastic Indicator is moving lower. Price is now trading below the 20, 50 and 200-period moving averages.
Our Daily resistance levels are at 105.68 and 107.04, with the support levels at 103.91 and 103.14.
Conclusion: The Federal Reserve Chairman confirmed that the Fed would moderate tightening but warned of inflation in his speech. We expect more volatility when the US PPI data is released this week. We expect that USD Index may move lower at least to touch our next support levels at 103.91 and 103.64.
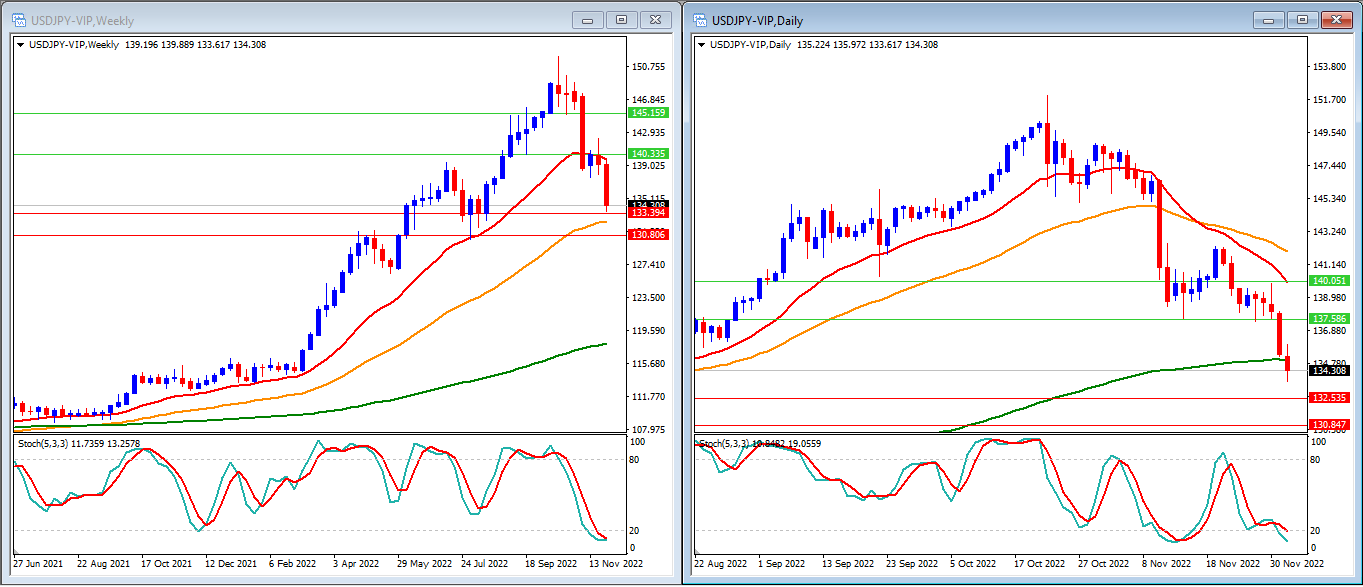
Last week, we expected to see USDJPY move higher but got lowered by the Fed’s speech. It went lower to reach our support levels. USDJPY closed the week at 134.30.
On the Weekly timeframe, we can see that the Stochastic Indicator is moving lower, entering the oversold level. The price moves just below the 20-period moving average but remains above the 50 and 200-period moving averages.
Our Weekly resistance levels are at 140.33 and 145.15, with the support levels at 133.39 and 130.80.
On the daily timeframe, the stochastic indicator moves lower, entering the oversold level. Price is moving below the 20 and 50-period moving averages and breaking below the 200-period moving average.
Our Daily resistance levels are 137.58 and 140.05, while the support levels are 132.53 and 130.84.
Conclusion: The Federal Reserve Chairman confirmed that the Fed would moderate tightening but warned of inflation in his speech. We expect more volatility when the US PPI data is released this week. We expect the USDJPY to move lower for this week and try to reach our support levels at 133.39 (weekly) and 132.53 (daily).