Spreads
Spreads
Spreads
Spreads
Spreads
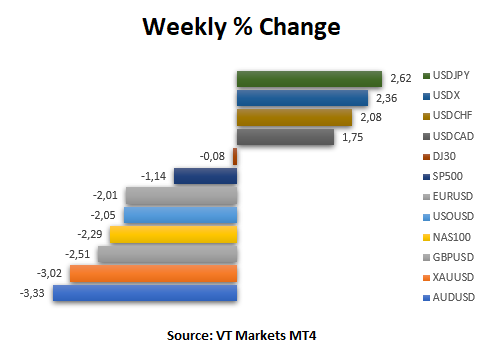
Last week, The USD index (USDX) hit a five-week high and posted its biggest weekly gain since April 2020 on Friday as investors adjusted for the likelihood that the Federal Reserve will keep hiking rates to battle inflation.
(All data is taken from the MT4 VT Markets)
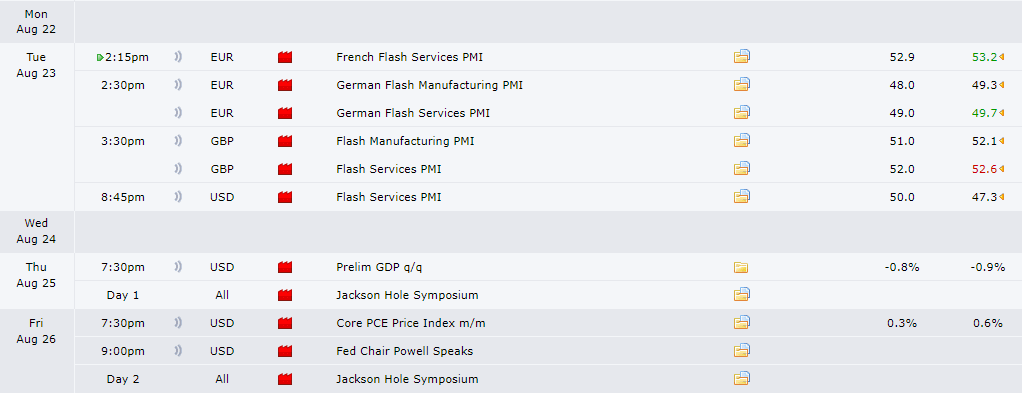
(Picture taken from forexfactory.com)
This week’s primary focus is on the US Federal Reserve’s 2022 Jackson Hole Symposium in Wyoming, with the topic “Reassessing Constraints on the Economy and Policy”. The 3-day event will happen from Thursday, 25 August, to Saturday, 27 August.
Other crucial US data to keep an eye on is the release of the Flash Services PMI, Prelim GDP, and Core PCE Price Index, scheduled throughout the week.
Meanwhile, France, Germany, and the UK will release their Flash Services PMI on Tuesday, with Germany and the UK releasing their Manufacturing PMI on the same day.
France’s Services PMI fell to 53.2 in July of 2022, from 53.9 in June.
It was the third successive decline in the growth rate and the weakest since January, with demand for services expanding at the softest pace since April 2021 amid reduced spending power among customers due to sky-high inflation.
Firms remained moderately positive in July despite mounting macro challenges.
Germany’s Flash Manufacturing PMI fell to 49.3 in July 2022 from 52.0 in June, indicating a slow-down in manufacturing. The biggest fall was in input demand due to a slow-down in the supply chain. Employment levels continued to rise slower, while business expectations were the lowest since May 2020.
In July 2022, Germany’s Flash Services PMI fell to 49.7 from 52.4 the previous month. New business declined for a second month, but the labour market continued to show resilience as firms looked to expand capacity. Business expectations turned negative due to concerns about high inflation and rising interest rates.
The UK Manufacturing PMI declined in July of 2022 to 52.1, from 52.8 in June of the same year, pointing to the lowest growth in factory activity since June of 2020. The decline mainly reflects downturns in the consumer and intermediate goods sub-industries.
UK’s Flash Services PMI fell to 52.6 in July of 2022 from 54.3 in June, pointing to the softest expansion in services activity in 17 months as inflationary pressures and the cost-of-living squeeze resulted in heightened economic uncertainty.
Business optimism was expected to remain for the next few months.
US Services PMI fell to 47.3 in July 2022, from 52.7 in June. Firms expanded their workforce numbers at the slowest pace since January. Although new orders returned to growth, the expansion rate was historically subdued and much slower than those seen earlier in the year.
Inflationary pressures remained historically elevated in July but eased further. Businesses are forecast to be better in the next few months.
The 2022 Economic Policy Symposium will take place on 25-27 August, with the topic, “Reassessing Constraints on the Economy and Policy”.
The markets expect speeches from the US Federal Reserve and other central bankers regarding current economic conditions and policies.
The US GDP shrank 0.9% in the second quarter of 2022, following a 1.6% decline in the first quarter and technically entering a recession.
US Fed Chair Jerome Powell recently said he did not believe the US was in a recession, making markets expect an increase of 0.5%.
The PCE Price Index in the US increased 1% month-on-month in June of 2022, the most significant increase since September 2005.
PCE Price Index data is forecast at 1% for July.
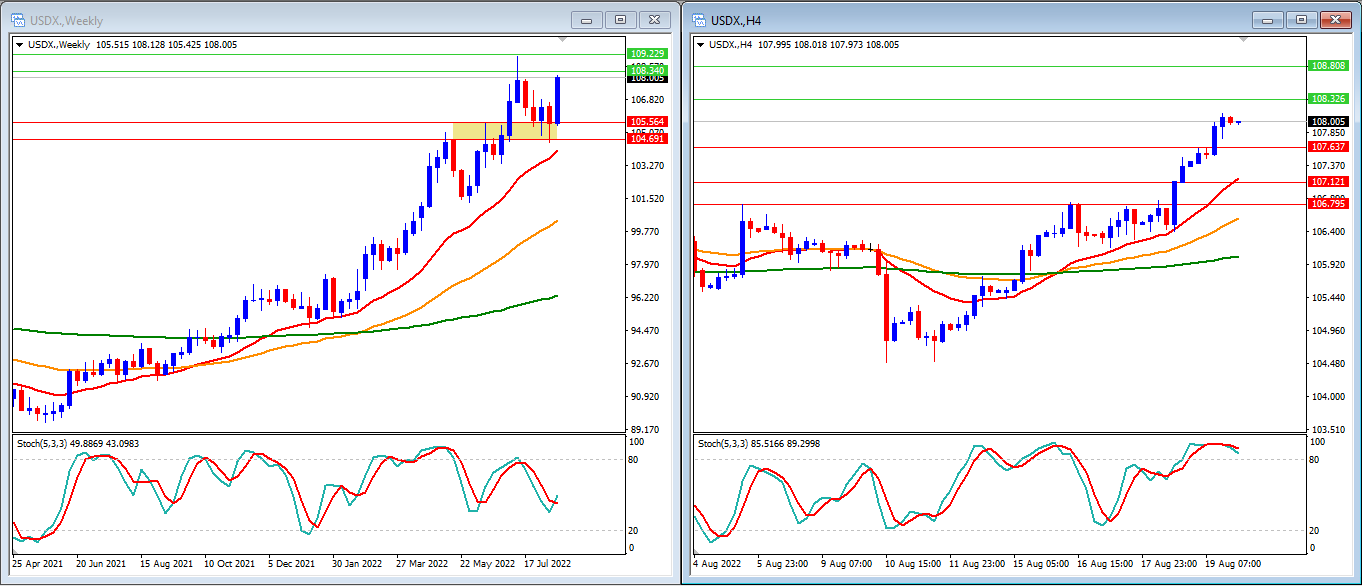
Last Week, The USD index (USDX) hit a five-week high and posted its biggest weekly gain since April 2020 on Friday, as investors adjusted for the likelihood that the US Federal Reserve will keep hiking rates to battle inflation. The price jumped, trying to reach our Resistance Level (108.34).
In the weekly timeframe, we can see that the Stochastic Indicators are crossing back up even though they have not touched the oversold level yet. This will indicate that the downward movement might be weaker. Meanwhile, the 20-, 50-, and 200-candle Moving Averages are getting closer to the weekly price candles, suggesting a lower buyer interest.
Our Weekly Resistance Levels are at 108.34 and 109.22, with the Support Levels at 105.56 and 104.69.
Meanwhile, in the H4 timeframe, we can see that the Stochastic Indicators have reached overbought levels and trying to reverse lower. The price moves above the 20-, 50-, and 200-candle Moving Averages, showing that some consolidating might happen prior to the lower movement in the short term.
Our H4 Resistance Levels are at 108.32 and 108.80, with the Support Levels at 107.63 and 107.12.
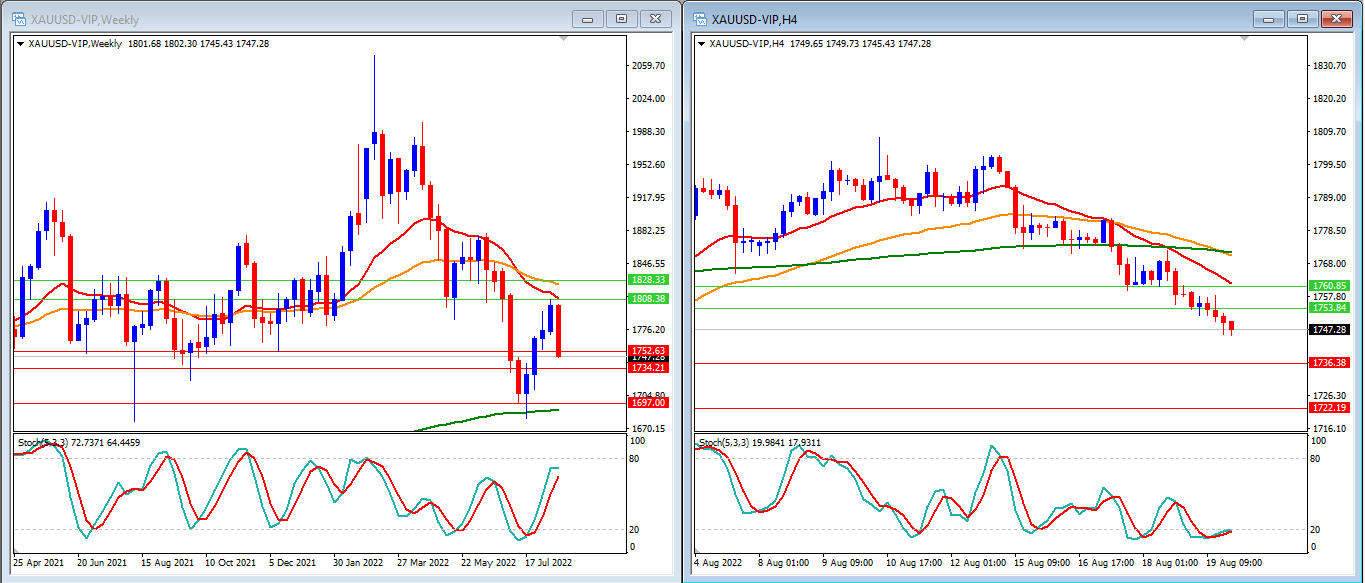
Last week, gold prices dropped after trying to reach our Resistance Levels. Potential movement this week is still between our Support and Resistance Levels, which haven’t been broken.
In the weekly timeframe, we can see that the Stochastic Indicators are showing a rising movement, demonstrating that Gold is moving higher. Gold price rises above the 200-candle Moving Average and cannot reach the 20-candle and 50-candle Moving Averages.
Our Weekly Resistance Levels are at US$1,808 and US$1,828, with the Support Levels at US$1,752 and US$1,734.
Meanwhile, in the H4 timeframe, we can see that the Stochastic Indicators show an oversold movement, starting to move higher. The price is now moving below the 20-, 50-, and 200-candle Moving Average.
Our H4 Resistance Levels are at $1,753 and $1,760, with the Support Levels at US$1,736 and US$1,722.
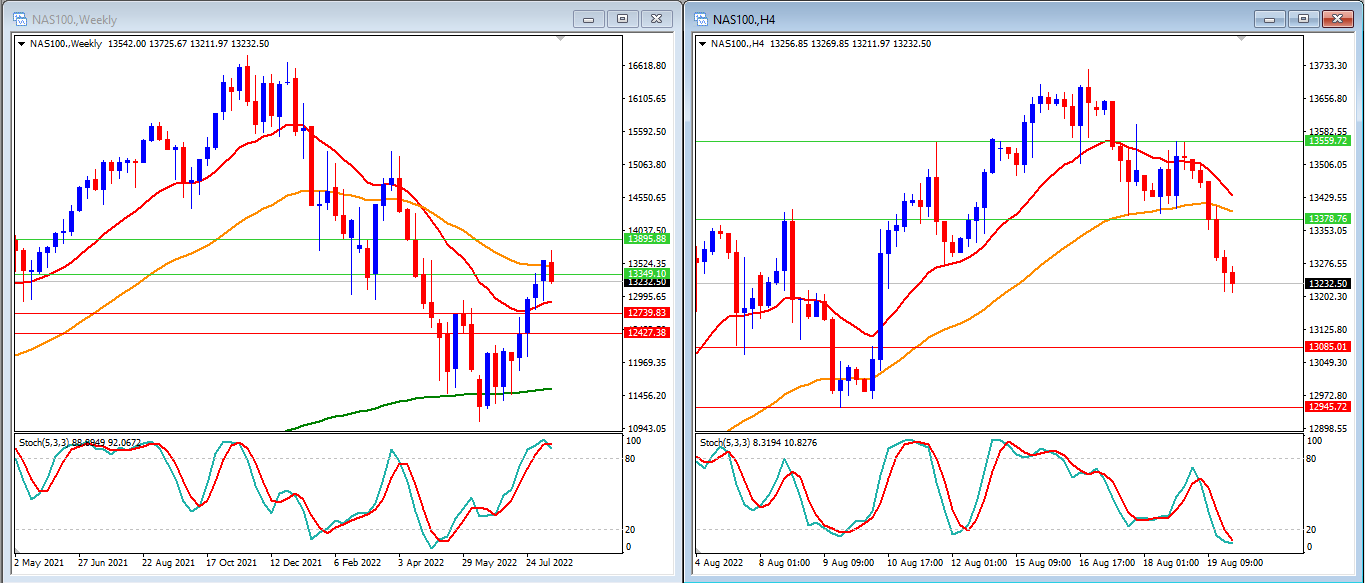
Last week, US stocks fell a little after weeks of stronger movement last week. This week, we must wait for the next movement for NAS100. Will it break our Resistance Levels? Or will it go back down?
In the weekly timeframe, we can see that Stochastic Indicators are inside the overbought level with a potential for reversal movement. With the price able to move above the 20-candle Moving Average and rejected at the 50-candle Moving Average, we can expect that the lower movements will continue.
Our Weekly Resistance Levels are at 13349 and 13895, with the Support Levels at 12739 and 12427.
While in our H4 timeframe, we can see that our Stochastic Indicators are inside the oversold level with a potential for reversal movement. Meanwhile, the price is still between 20- and 50-candle Moving Averages, yet still far above the 200-candle Moving Averages.
Our H4 Resistance Levels are at 13378 and 13559, while the Support Levels are at 13085 and 12945.
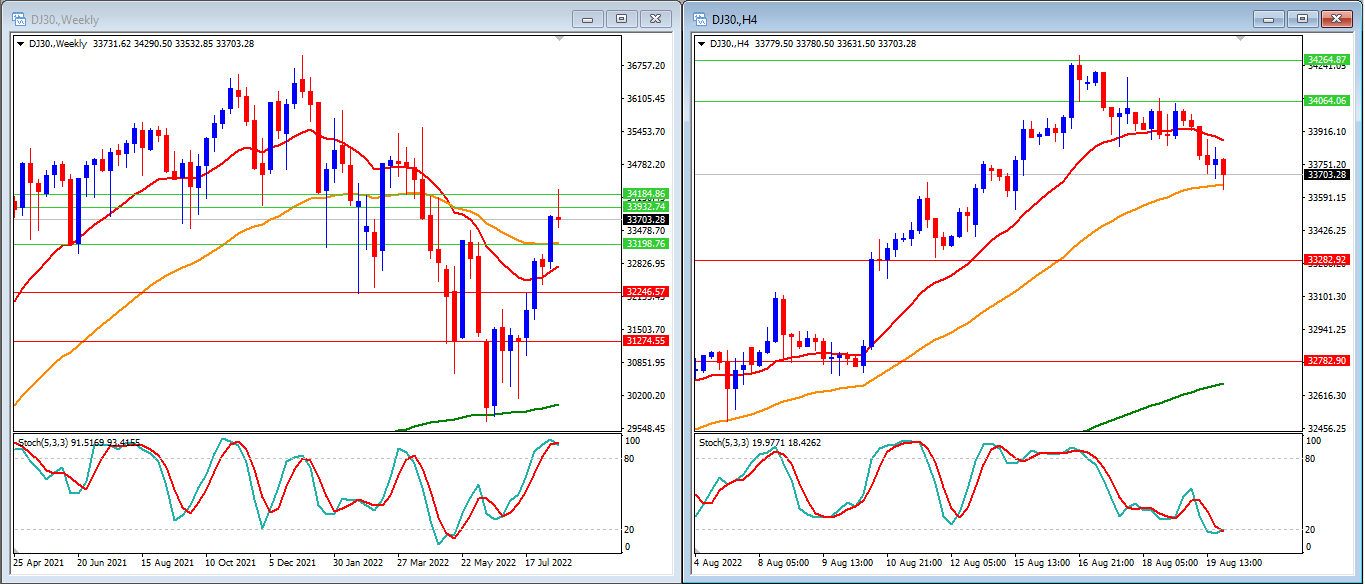
Last week, US stocks fell a little after weeks of stronger movement. This week, we must wait for the next movement for DJ30. Will it break our Resistance Levels? Or will it go back down?
In the weekly timeframe, we can see that Stochastic Indicators are entering the overbought level. With the price moving above the 20-, 50-, and 200-candle Moving Average, we can expect that higher movement is still limited, with the potential for a low reversal after reaching our next Resistance Levels.
Our Weekly Resistance levels are at 33932 and 34184, with the Support Levels at 32246 and 31274.
While in our H4 timeframe, we can see that our Stochastic Indicators are inside an oversold level and trying to move higher. We can expect the DJ30 to go higher, with the potential reversal in the short term. The price is moving below the 20-candle Moving Average but above the 50- and 200-candle Moving Average.
Our H4 Resistance levels are at 34064 and 34264, while the Support Levels are at 33282 and 32782.