Spreads
Spreads
Spreads
Spreads
Spreads
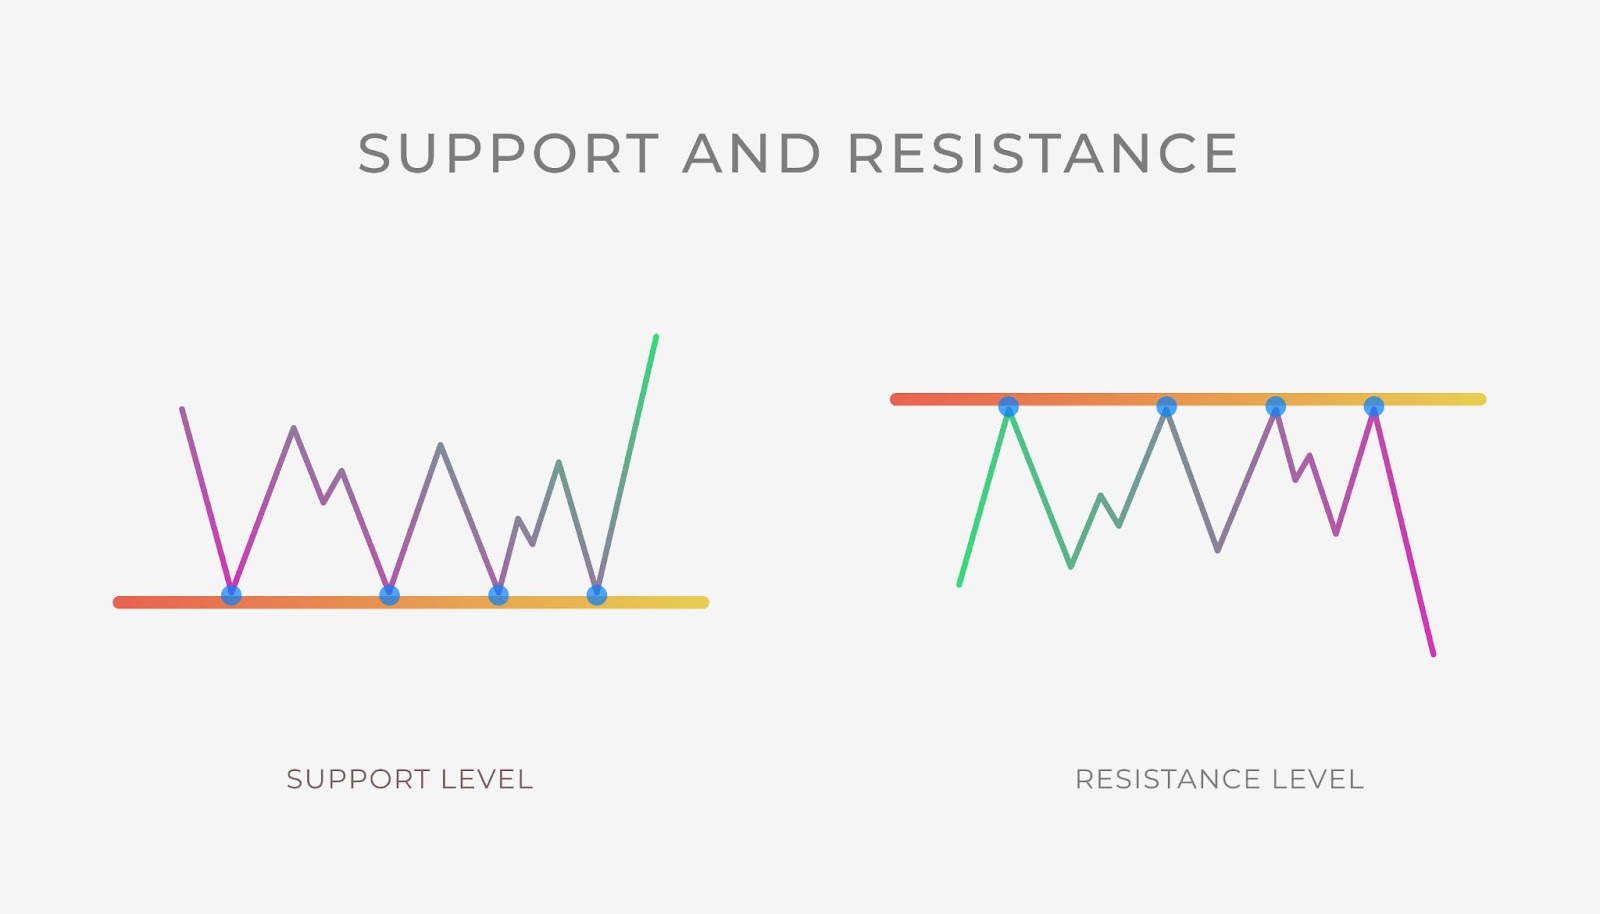
You hear these words a lot from traders—support and resistance. And if you’re new to trading, you’re probably wondering what they mean and how they can help you make the best trading decisions.
In its essence, support means that a downtrend may stop because of increased buying interest or demand. Resistance means that an uptrend is expected to pause due to an increased selling interest.
Here are some of the most important things that you need to know about support and resistance:
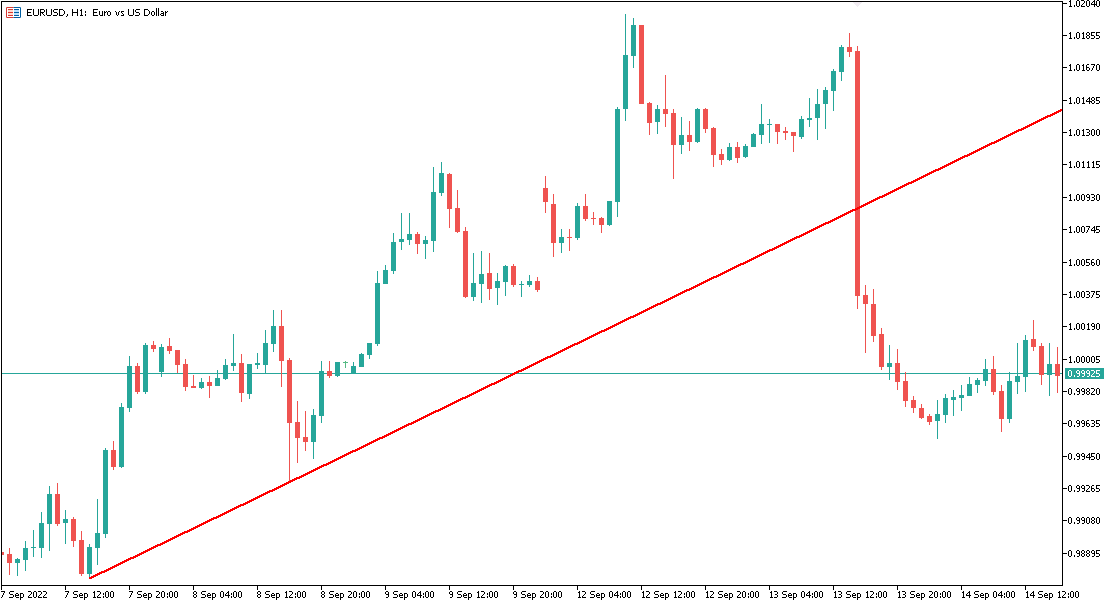
Trendlines. These are angled or horizontal lines highlighting support and resistance in a chart. If you’re in an uptrend, there are higher highs and higher lows, while in a downtrend, there are lower lows and lower highs. You need to connect those highs and lows during a trend and extend that line to the right of the chart to determine where the price may reach support or resistance at some point. Trendlines are very important because they help you decide when to buy or sell.

Major and minor. Support and resistance levels can be classified as major and minor, which means that a trend can fluctuate from going down low and suddenly bouncing up before going back down again. If this happens, you call it a minor support area. If the situation follows an uptrend, you call that a major resistance area. Knowing your major and minor support and resistance levels will allow you to see potential trading opportunities so you can take advantage of them and not get left behind by the pack.

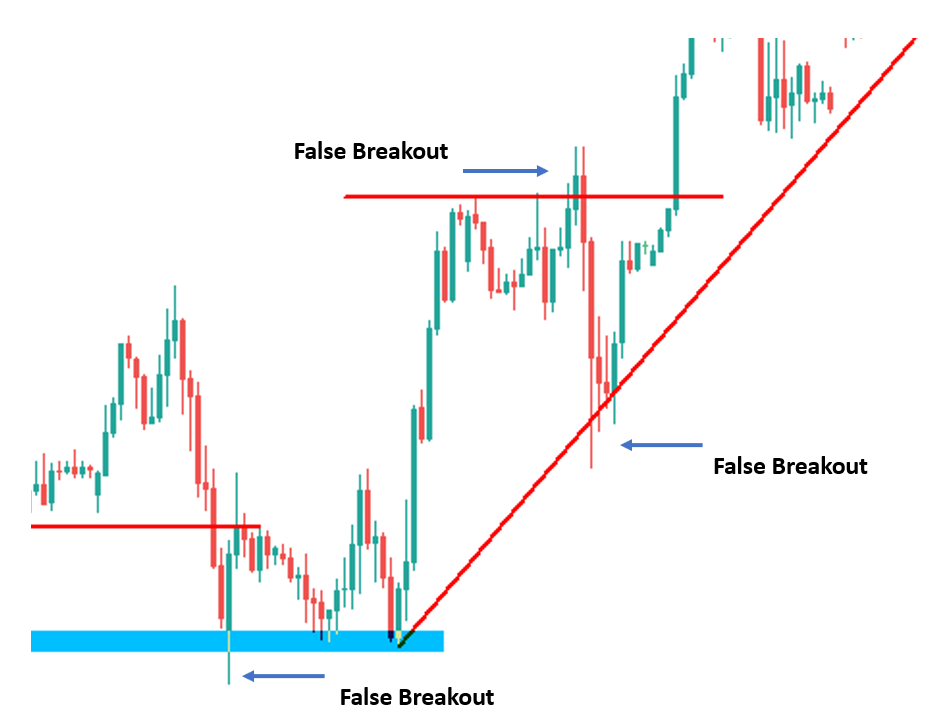
False breakouts. Although support and resistance levels are highly reliable determinants for buying, selling, or sitting the market out, there are some instances when prices will move slightly further than expected—a phenomenon called a false breakout. Since support and resistance are not exact prices, you can expect that price analysis could be lower or higher than the real price. While this could cause some risks to you as a trader, some experts would say this is a great opportunity to trade. If you know how to identify a false breakout, you can wait for it to occur on the chart and only enter the market after it happens. That will help you ensure a better trade while still following your analysis based on support and resistance levels.
Trading decisions. The trick to taking advantage of opportunities based on support and resistance is to buy near them because you’ll never know when that trend will stop. Keep in mind that trends play a huge role in dictating where things will be for trading, so you need to be keen on looking for those support and resistance opportunities and take advantage of them before they’re gone. This is why it pays to trade in a platform where all the data you need is right in your hands, and you can also ask for expert advice from people who know these levels well.
At the end of the day, being a successful trader will boil down to how dynamic you are in making trading decisions. While there are no hard-and-fast rules to succeeding in trading, there are strategies and methods like support and resistance to guide you through your trading journey.
Learn all these concepts, talk to people within the trading community, and choose a platform where you can nurture yourself as a trader while building your portfolio and growing your investment.
Get in touch with our team at VT Markets to know more about what we can offer to traders like you.