Spreads
Spreads
Spreads
Spreads
Spreads
The market’s focus this week remains on Russia-Ukraine tensions, with the US believing that Russia will strike Ukraine in the next few days. Although neither party has commented on this, we should be cautious of the potential impact of the Us comments on the market.
Additionally, the Reserve Bank of New Zealand (RBNZ) is predicted to raise interest rates to 1.00 per cent from 0.75 per cent this week, a rise that is likely to occur given the NZD’s recent strength.
Potential movement for the week: NZDUSD and GOLD
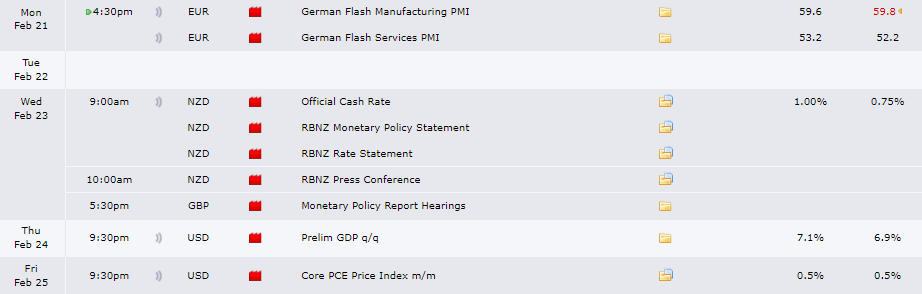
Source: Forex Factory | Time: GMT+8
In the last week’s movement, the USD Index is still in the range between 95.8 – 96.60, with the highest price at 96.42 when referring to MT4 from VT Markets.
On the daily timeframe, we can see that the price is above the Moving Average, which indicates market strength is still moving upwards with a potential correction to 95.90.
Similarly, on the H4 period, we can see that the price is above the Moving Average, which is likewise at the 95.90 level, indicating the possibility of the USD Index strengthening to 96.40.
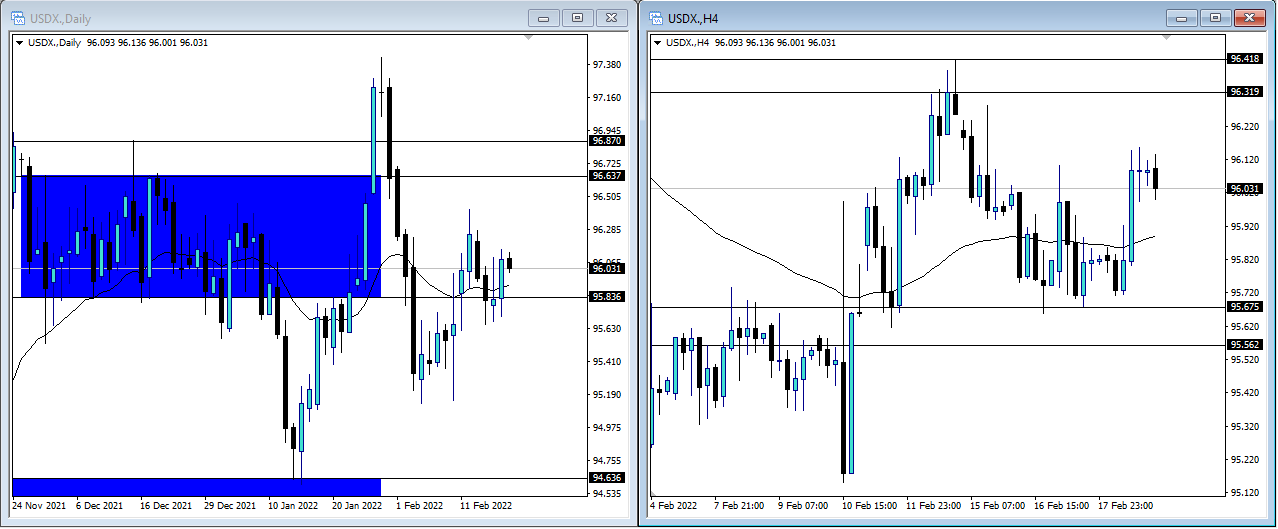
Source: VT Markets MT4
Gold has once again proved its significance as a safe-haven asset, where when geopolitical tensions develop, Gold is the most heavily impacted, increasing significantly. Gold will be impacted again this week as the situation between Russia and Ukraine remains unclear.
If we look at the weekly timeframe, we can see that the Market broke above 1900 last week (for the first time since May 2021), reaching a high of 1902. This week, the highest possible number will be broken again with the potential for entry into the 1904-1916 resistance area.
On the smaller timeframe, H4, we can see that Gold is currently between the range 1886-1889 as a support area and 1904-1916 as a resistance area.
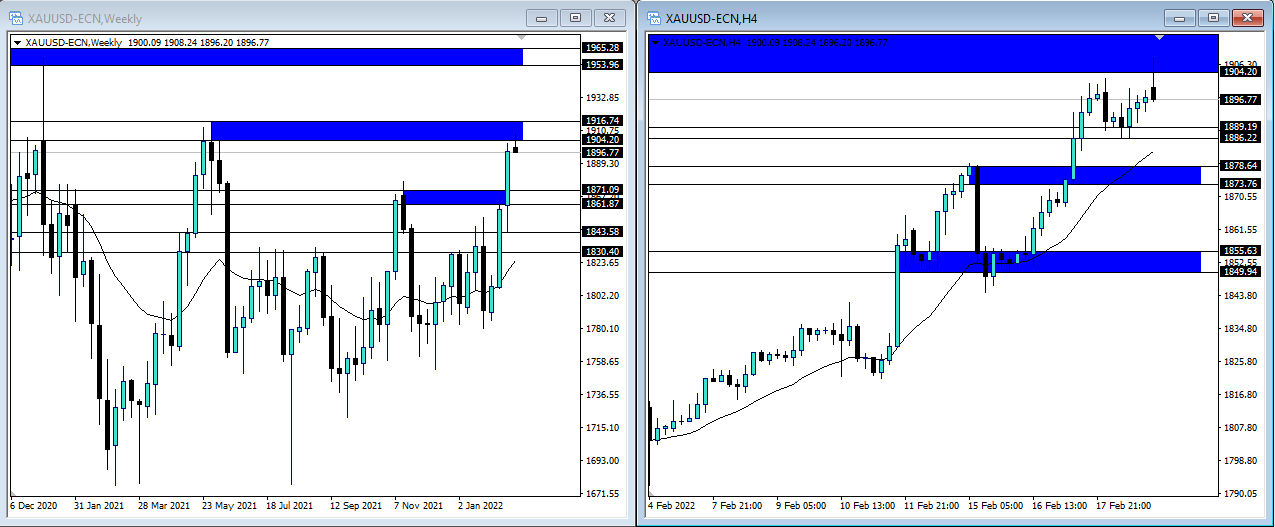
Source: VT Markets MT4