Spreads
Spreads
Spreads
Spreads
Spreads
Make informed decisions with the most up-to-date and reliable financial data, exclusively provided by vtmarkets.com.
EUR/USD Stabilizes Amid Anticipation of Key Economic Data
The EUR/USD pair has been hovering around the 1.0850 mark, showing little movement as traders await impactful economic releases. Following a more significant than expected decline in US Durable Goods Orders for January, market focus now shifts to upcoming US GDP figures, German Retail Sales, CPI data, and the US PCE inflation report. These forthcoming data points are crucial for gauging the economic health of both regions and could potentially influence the currency pair’s direction.
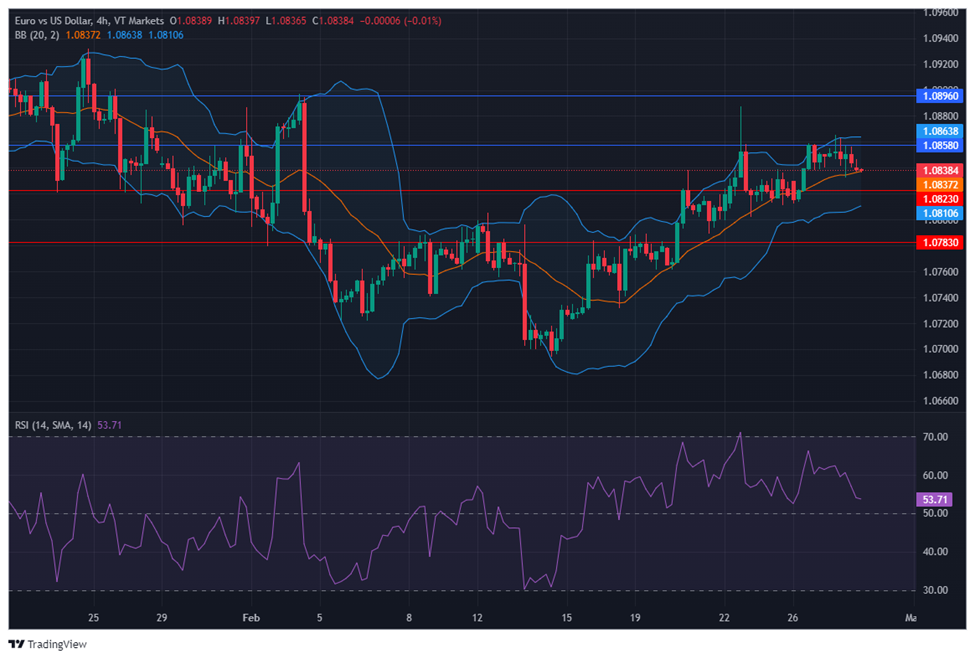
On Tuesday, the EUR/USD moved slightly lower and was able to reach the middle band of the Bollinger Bands. Currently, the price is moving around the middle band, suggesting a potential downward movement to reach below the middle band. Notably, the Relative Strength Index (RSI) maintains its position at 53, signaling a neutral outlook for this currency pair.
Resistance: 1.0858, 1.0896
Support: 1.0823, 1.0783
XAU/USD See Modest Gains Amid Weakening Dollar and Anticipation for Key Economic Reports
Gold (XAU/USD) experienced a slight increase in its price during Tuesday’s mid-North American session, trading at $2,034.88, a 0.18% gain, amid a backdrop of falling US Treasury bond yields and a weakening US Dollar, as indicated by a 0.05% drop in the US Dollar Index (DXY). This modest uptick occurs as the precious metal hovers around the 50-day Simple Moving Average, with investors keenly awaiting the Personal Consumption Expenditures (PCE) report and latest Gross Domestic Product (GDP) data, which are anticipated to be significant factors that could drive Gold out of its current $2,020-$2,050 trading range. The outlook is further clouded by the recent report on Durable Goods Orders for January, which fell more sharply than expected, and mixed Home Prices data, suggesting a potentially volatile period ahead for Gold prices.
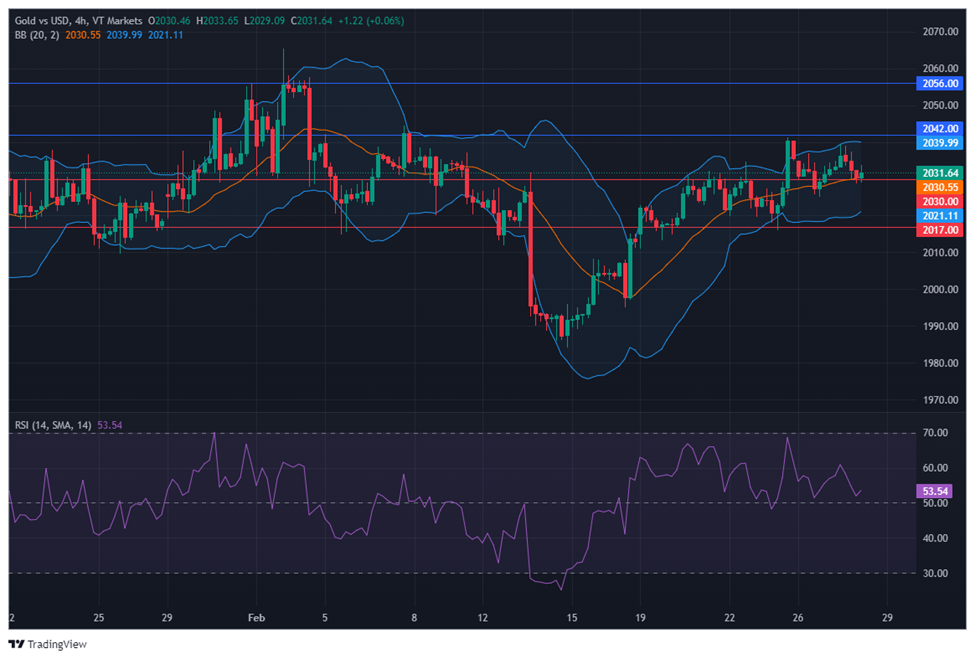
On Tuesday, XAU/USD moved lower to reach the middle band of the Bollinger Bands. Currently, the price is moving just above the middle band, suggesting a potential consolidation movement. The Relative Strength Index (RSI) stands at 53, signaling a neutral outlook for this pair.
Resistance: $2,042, $2,056
Support: $2,030, $2,017
Make informed decisions with the most up-to-date and reliable financial data, exclusively provided by vtmarkets.com.