Spreads
Spreads
Spreads
Spreads
Spreads
Make informed decisions with the most up-to-date and reliable financial data, exclusively provided by vtmarkets.com.
EUR/USD Faces Downward Pressure Amid Greenback’s Uptrend and Divergent ECB Signals
In Wednesday’s trading session, EUR/USD encountered downward pressure, briefly touching multi-week lows before rebounding. The prevailing uptrend in the US dollar, fueled by robust December Retail Sales, tempered expectations of a Fed rate cut in March. CME Group’s FedWatch Tool indicated a shift, with the probability dropping to just above 50%. Meanwhile, ECB officials, including Knot and Vasle, highlighted market expectations for rate cuts, emphasizing alignment for a 2% inflation target by 2025. Lagarde hinted at a potential rate cut in the summer. Bond yield increases globally, particularly German 10-year bunds and rising US yields, contributed to the euro’s weakness. Poor Chinese fundamentals added to concerns about delayed economic recovery.
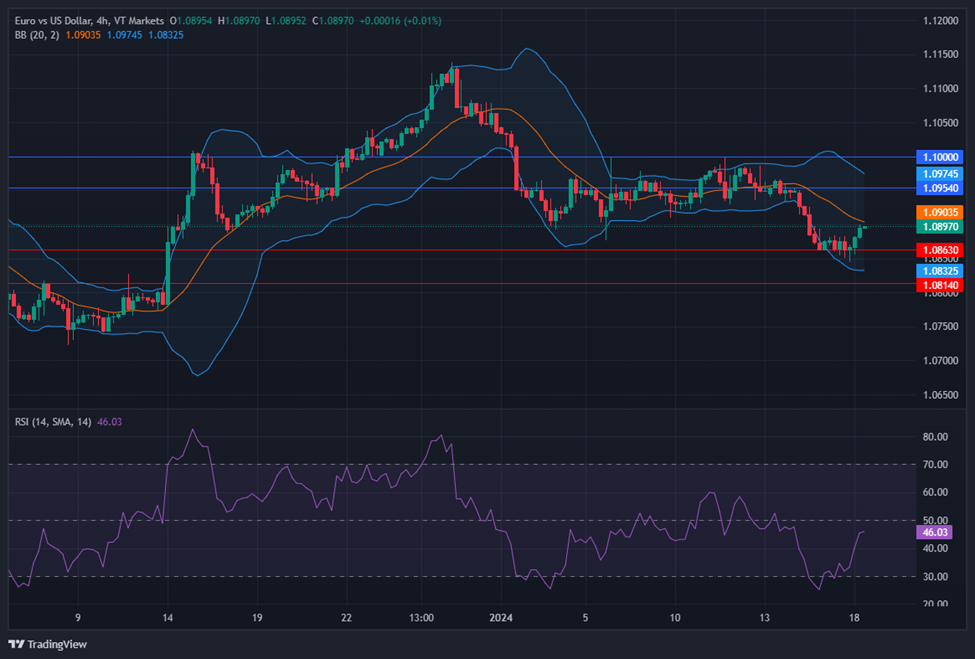
On Wednesday, the EUR/USD moved slightly higher, trying to reach the middle band of the Bollinger Bands. Currently, the price moving just below the middle band, suggesting a potential upward movement to reach above the middle band. Notably, the Relative Strength Index (RSI) maintains its position at 46, signaling a neutral outlook for this currency pair.
Resistance: 1.0954, 1.1000
Support: 1.0863, 1.0814
XAU/USD Slumps to Mid-December Lows as Dollar Surges Amidst Global Stock Decline
Spot gold, represented by XAU/USD, experiences a downturn, reaching its lowest point since mid-December. The decline is attributed to the strengthening US Dollar, which advances as global stocks continue to fall. Investors are scaling back expectations for a Federal Reserve rate cut in March, evident in the decreasing probability from 70% to 52% according to the CME FedWatch Tool. Mixed US data, including positive Retail Sales and Industrial Production figures, alongside hawkish sentiments from Fed officials, contribute to the diminishing likelihood of a March cut. Rising government bond yields and a continued slump in Wall Street further compound the challenges for gold in this market environment.
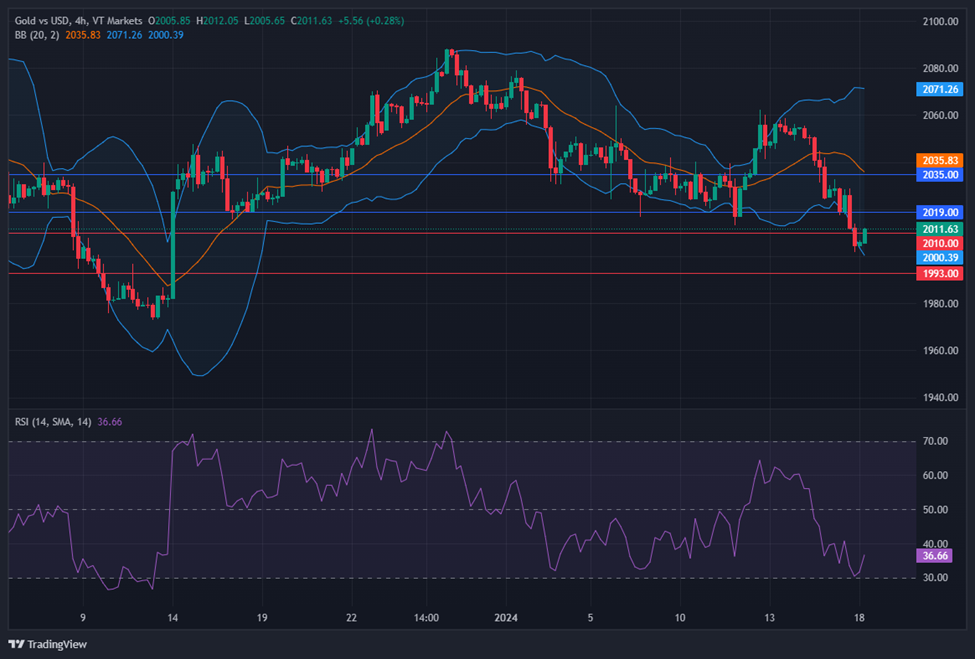
On Wednesday, XAU/USD moved lower and was able to create a lower push to the lower band of the Bollinger Bands. Currently, the price moving just above the lower band suggesting a potential downward movement to create another lower push to the lower band. The Relative Strength Index (RSI) stands at 36, signaling a bearish outlook for this pair.
Resistance: $2,019, $2,035
Support: $2,010, $1,993
Make informed decisions with the most up-to-date and reliable financial data, exclusively provided by vtmarkets.com.