Spreads
Spreads
Spreads
Spreads
Spreads
Make informed decisions with the most up-to-date and reliable financial data, exclusively provided by vtmarkets.com.
EUR/USD Continues Decline Amidst Economic Indicators and Central Bank Signals
The EUR/USD pair sustained its sixth consecutive day of decline, plunging below 1.0770, marking its lowest point since mid-November. This downward trend stems from a weakened Euro juxtaposed against a robust US Dollar, intensifying pressure on the currency pair. Anticipation hovers around US job data, where the European Central Bank’s (ECB) projected rate cuts for 2024, ahead of the Federal Reserve (Fed), have notably impacted the EUR/USD dynamics. Despite subpar US data failing to prompt significant movement, the German 10-year bond yield’s drop, surpassing its US counterpart, indicates a complex market sentiment. Eurozone Retail Sales and Germany’s Factory Orders, showcasing mixed results, contribute to the growing expectation of ECB easing. Meanwhile, in the US, the ADP report hinted at a tightening labor market but failed to deter the resilient Dollar. With upcoming critical events such as Jobless Claims, Nonfarm Payrolls, the Consumer Price Index (CPI), and the impending FOMC decision, the market focus remains intensely fixated on the EUR/USD trajectory amidst these economic indicators and central bank signals.
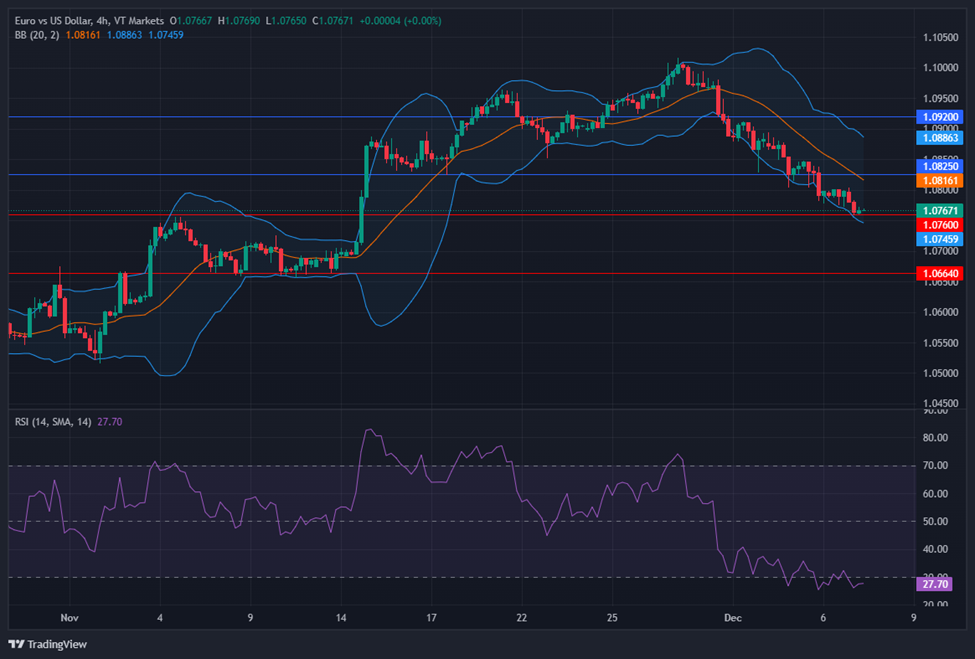
On Wednesday, the EUR/USD experienced a downward movement, creating a push to the lower band of the Bollinger Bands. Currently, the price moving slightly above the lower band, suggesting a potential upward movement, potentially reaching the middle band before goes back lower. Notably, the Relative Strength Index (RSI) maintains its position at 27, signaling a bearish outlook for this currency pair.
Resistance: 1.0825, 1.0920
Support: 1.0760, 1.0664
XAU/USD Consolidates Amid Economic Data and Dollar Strength
Gold (XAU/USD) experienced a notable shift as it recovered from recent lows near $2,008 following its pullback from record highs above $2,130. Currently consolidating around the $2,030 support level, the metal finds itself grappling with lower Treasury yields while facing a resilient US Dollar. Despite softer employment figures and declining 10-year Treasury yields, Gold’s upward momentum remains subdued. The metal retains a bullish long-term trend, yet it’s notably distant from its recent historic peaks, with its stability hinting at a complex interplay of economic data and currency strength. The looming release of further US employment data stands poised to influence Gold’s trajectory in the coming days.
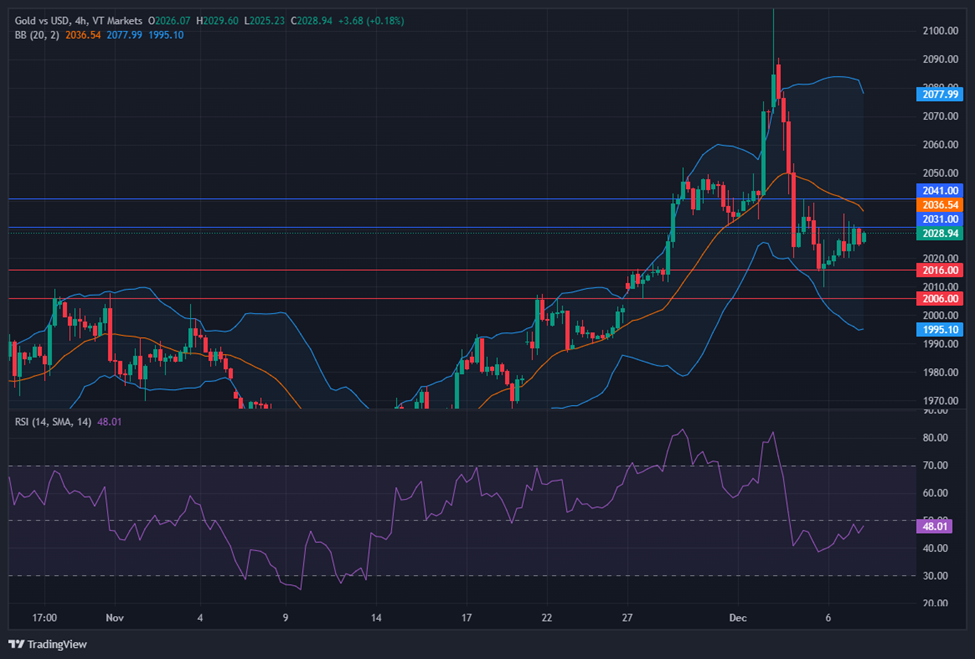
On Wednesday, XAU/USD moved slightly higher trying to reach the middle band of the Bollinger Bands. The current movement suggests a potential upward trend, possibly reaching the middle band. The Relative Strength Index (RSI) stands below 48, indicating a neutral sentiment for this pair.
Resistance: $2,031, $2,041
Support: $2,016, $2,006
Make informed decisions with the most up-to-date and reliable financial data, exclusively provided by vtmarkets.com.