Spreads
Spreads
Spreads
Spreads
Spreads
Make informed decisions with the most up-to-date and reliable financial data, exclusively provided by vtmarkets.com.
Gold (XAUUSD)
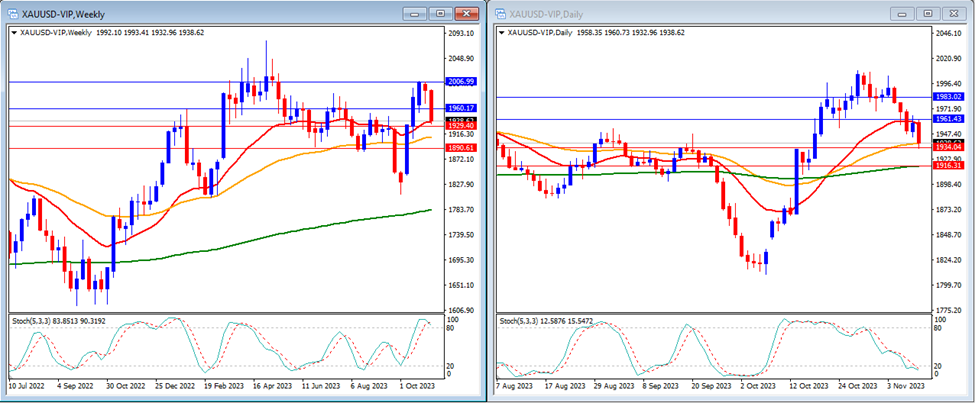
Last week, gold moved lower and was able to break below our support levels, closing the week at $1,938.
On the weekly timeframe, it can be observed that the Stochastic Indicator is moving within the overbought area. Gold is currently trading at the 20 and above both the 50 and 200-period moving averages.
Our weekly resistance levels are at $2,006 and $1,960, with support levels at $1,929 and $1,890.
On the daily timeframe, the Stochastic Indicator is trending slightly lower towards the middle, while the price of gold is currently trading above the 20, 50, and 200-period moving averages.
Our daily resistance levels are at $1,961 and $1,983, with support levels at $1,934 and $1,916.
Conclusion: This week, high volatility is expected due to impactful news from the US, such as inflation and retail sales data, which directly affect gold prices. Additionally, the focus is on the tension in the Middle East, expected to significantly impact the gold market, given its status as a safe haven. We anticipate a slight correction in gold prices this week, with expectations of a downward movement to reach our support level at $1,929.
EURUSD
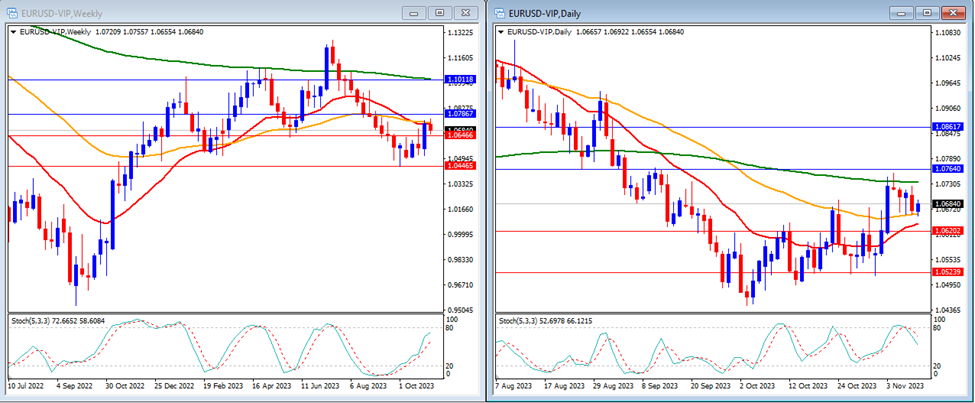
Last week, the EUR/USD moved slightly lower and continued fluctuating between our support and resistance levels, closing the week at 1.0684.
On the weekly timeframe, the Stochastic Indicator is trending higher, targeting the overbought area. The price is currently trading around the 20 and 50-period moving averages, but remains below the 200-period moving average.
Our weekly resistance levels are at 1.0786 and 1.1011, with support levels at 1.0646 and 1.0446.
On the daily timeframe, the Stochastic Indicator is trending lower towards the middle, while the price of EUR/USD is trading above the 20 and 50-period moving averages, but below the 200-period moving average.
Our daily resistance levels are at 1.0764 and 1.0861, while the support levels are at 1.0620 and 1.0523.
Conclusion: We anticipate a week of high volatility for EUR/USD, driven by impactful news from the US. We expect the EUR/USD to move slightly lower, potentially falling below our support level at 1.0620.
DJ30
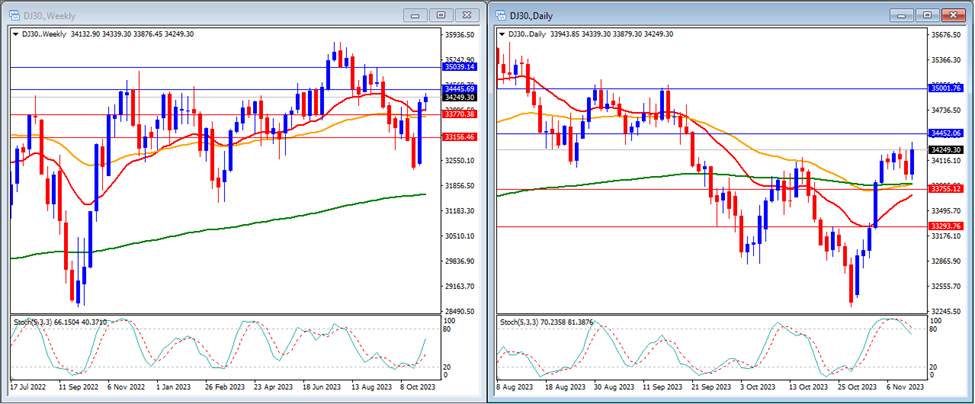
Last week, the DJ30 moved higher and managed to fluctuate between our support and resistance levels, closing the week at 34,445.
On the weekly timeframe, it can be observed that the Stochastic Indicator is trending upwards, positioned in the middle. The price is currently trading above the 20, 50, and 200-period moving averages.
Our weekly resistance levels are at 34,445 and 35,039, with support levels at 33,770 and 33,156.
On the daily timeframe, it is noticeable that the Stochastic Indicator is within the overbought area. Currently, the price is trading above the 20, 50, and 200-period moving averages.
Our daily resistance levels are 34,452 and 35,001, with support levels at 33,755 and 33,293.
Conclusion: The US stock market is expected to face a week of high volatility due to impactful US news, specifically inflation and retail sales data. We anticipate that the DJ30 may move higher, influenced by market trends favoring US Dollar weakness, with a potential target at our resistance level of 34,452.
USOUSD
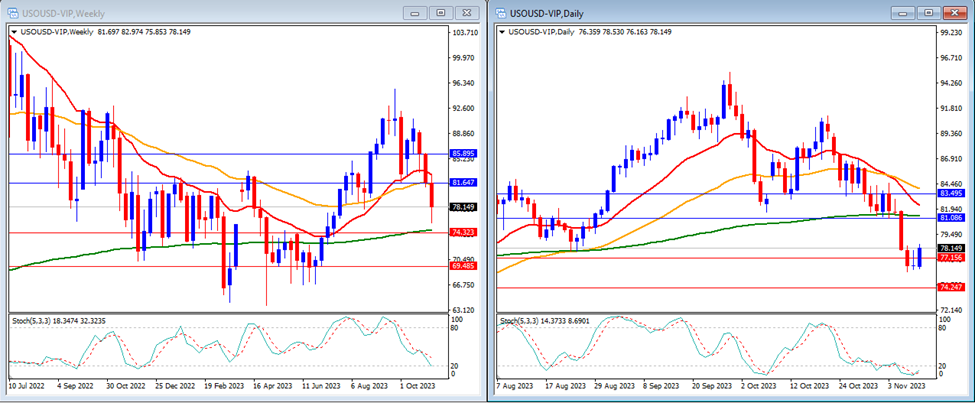
Last week, USOUSD (Oil) moved lower and managed to break below our daily support levels, closing the week at 78.14.
On the weekly timeframe, it can be observed that the Stochastic Indicator is currently trending lower, targeting the oversold area. The price is trading below both the 20-period and 50-period moving averages, but remains above the 200-period moving average.
Our weekly resistance levels are 81.64 and 85.89, with support levels at 74.32 and 69.48.
On the daily timeframe, the Stochastic Indicator is positioned within the oversold area, and the price is currently trading below the 20, 50, and 200-period moving averages.
Our daily resistance levels are at 81.08 and 83.49, while support levels are at 77.15 and 74.24.
Conclusion: We anticipate further significant movement in USOUSD, influenced by the latest sentiments around the Middle East tensions. There’s a possibility of a downward trend, with USOUSD potentially reaching our next support level at 77.15.
NAS100
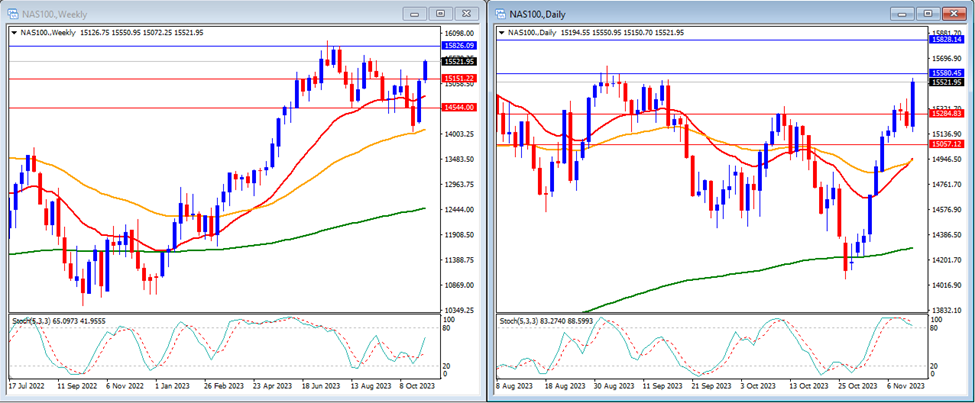
Last week, the NAS100 moved higher and was able to break through our previous resistance levels, though it closed the week at a lower level of 15,521.
On the weekly timeframe, the Stochastic Indicator is currently moving flat, just above the oversold area. The price is currently trading above the 20, 50, and 200-period moving averages.
Our weekly resistance levels are 15,826, with support levels at 15,151 and 15,544.
On the daily timeframe, the Stochastic Indicator is trending higher and entering the overbought area. The price is currently trading above the 20, 50, and 200-period moving averages.
Our daily resistance levels are currently at 15,580 and 15,828, while support levels are at 15,284 and 15,057.
Conclusion: The US stock market is expected to face a week of high volatility due to impactful news from the US, particularly inflation and retail sales data. We anticipate that the NAS100 may trend higher, influenced by the market’s inclination towards US Dollar weakness, with a potential target at our next resistance level of 15,826.
GBPUSD
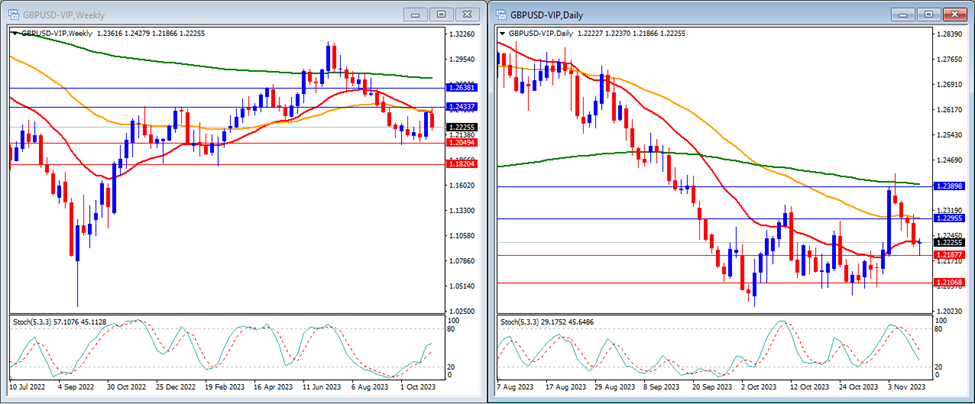
Last week, GBPUSD moved lower and managed to break below our previous daily support levels, closing the week at 1.2225.
On the weekly timeframe, the Stochastic Indicator is currently trending higher, positioned in the middle. The price is trading below the 20-period, 50-period, and 200-period moving averages.
Our weekly resistance levels are at 1.2433 and 1.2638, while support levels are at 1.2049 and 1.1820.
On the daily timeframe, our Stochastic Indicator is trending lower, targeting the oversold area. Meanwhile, the price is trading around the 20-period moving average but remains below both the 50 and 200-period moving averages.
Our daily resistance levels are now at 1.2295 and 1.2389, while support levels are at 1.2187 and 1.2106.
Conclusion: This week, we expect high volatility in GBPUSD due to impactful data releases from both the US and the UK, specifically inflation and retail sales data. We anticipate that GBPUSD will continue its upward movement, with the potential to surpass our next resistance level at 1.2295.
USD Index
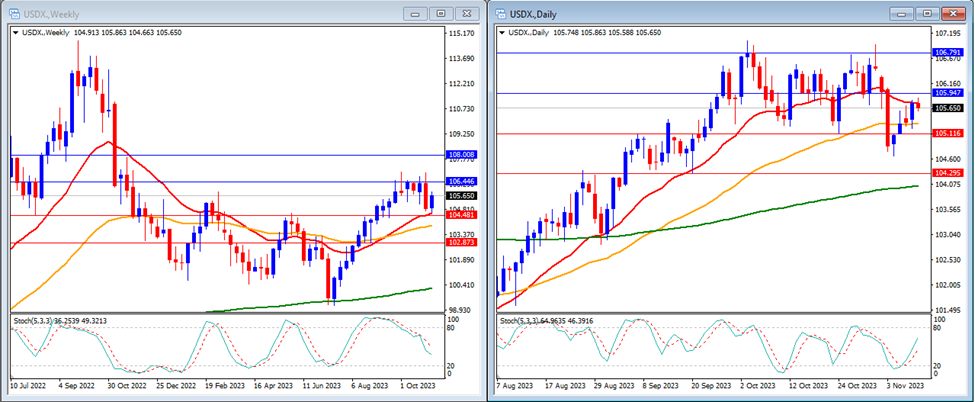
Last week, the USD Index traded higher and managed to break above our previous resistance levels, closing the week at 105.65.
On the weekly timeframe, it can be observed that the Stochastic Indicator is trending lower, positioned in the middle. The price is currently trading above the 20, 50, and 200-period moving averages.
Our weekly resistance levels are 106.44 and 108.00, with support levels at 104.48 and 102.87.
On the daily timeframe, the Stochastic Indicator is trending higher, positioned in the middle. The price is trading below the 20-period moving average but remains above both the 50 and 200-period moving averages.
Our daily resistance levels are 105.94 and 106.79, with support levels at 105.11 and 104.29.
Conclusion: This week, we expect high volatility in the USD Index, driven by impactful news from the US, including inflation and retail sales data. Additionally, attention must be given to the Middle East tension. We anticipate the USD Index to trend lower, potentially reaching our next support level at 104.48.
USDJPY
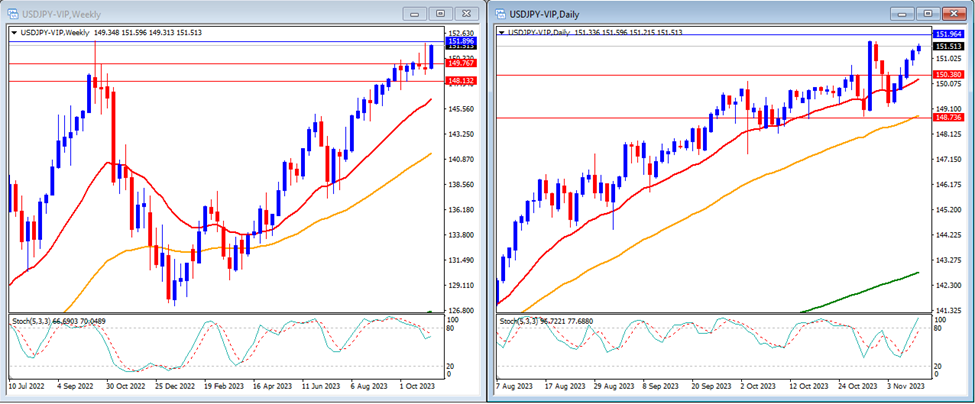
Last week, USDJPY traded higher and managed to break above our resistance levels, closing the week at 151.51.
On the weekly timeframe, it can be observed that the Stochastic Indicator has recently exited the overbought area. The price is currently trading above the 20-period, 50-period, and 200-period moving averages.
Our weekly resistance levels are 151.89, with support levels at 149.76 and 148.13.
On the daily timeframe, the Stochastic Indicator is trending higher, aiming for the overbought area. The price is currently trading above the 20, 50, and 200-period moving averages.
Our daily resistance levels are currently at 151.96, while the support levels are at 150.38 and 148.73.
Conclusion: We anticipate a week of high volatility for USDJPY due to impactful news in the US, which directly affects the pair. However, the market remains vigilant for updates on the Middle East tensions and potential interventions by the Bank of Japan in the currency market. We expect the pair to move lower, as the market sentiment currently burdens the US Dollar. We foresee USDJPY potentially reaching our support level at 149.76.
Make informed decisions with the most up-to-date and reliable financial data, exclusively provided by vtmarkets.com.