Spreads
Spreads
Spreads
Spreads
Spreads
Make informed decisions with the most up-to-date and reliable financial data, exclusively provided by vtmarkets.com.
Gold (XAUUSD)
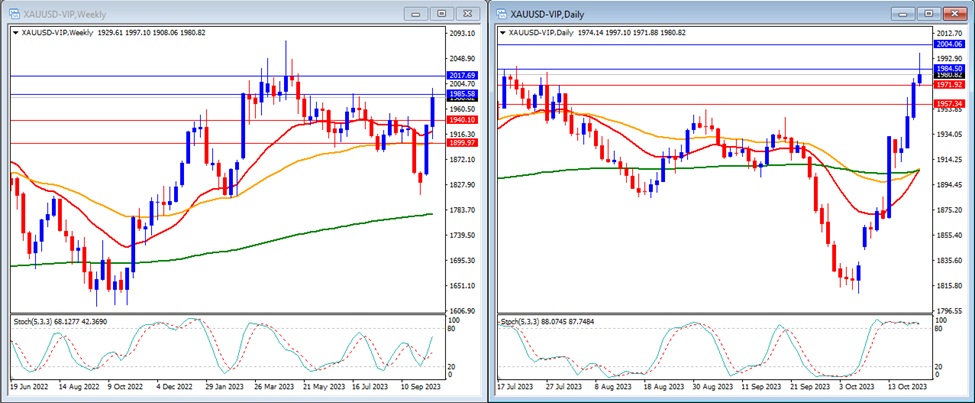
Last week, gold soared and broke above our resistance levels. Gold closed the week at $1,980.
On the weekly timeframe, we can observe that the Stochastic Indicator is moving higher within the middle. The gold price is trading above the 20, 50, and 200-period moving averages.
Our weekly resistance levels are at $1,985 and $2,017, with support levels at $1,940 and $1,899.
On the daily timeframe, the Stochastic Indicator is positioned within the overbought area, and the price is currently trading above the 20, 50, and 200-period moving averages.
Our daily resistance levels are at $1,984 and $2,004, with support levels at $1,971 and $1,957.
Conclusion: This week, our focus will be on the tensions in the Middle East, which are expected to significantly impact the gold market due to its status as a safe haven. Additionally, we will receive some high-impact data from the US. We anticipate a positive sentiment for gold this week, with expectations of its price moving higher as we aim to reach our resistance level at $2,004.
EURUSD
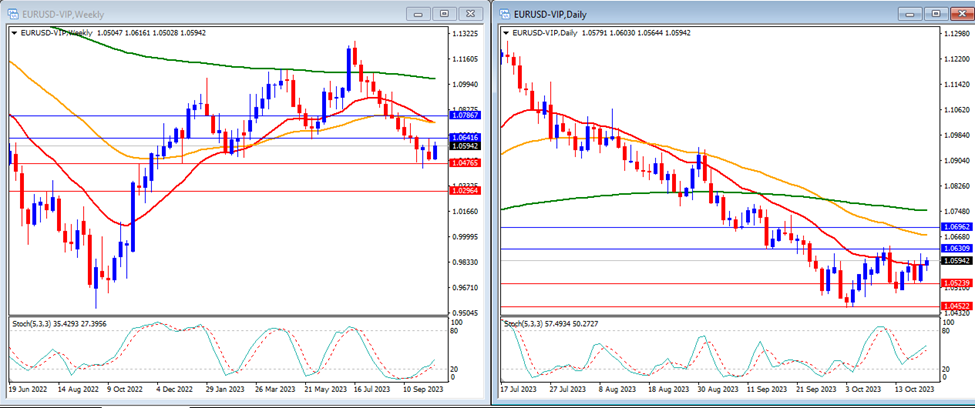
Last week, EURUSD moved higher and was able to surpass our daily resistance levels. EURUSD closed the week at 1.0594.
On the weekly timeframe, the Stochastic Indicator is moving higher, exiting the oversold area. The price is trading below the 20-period, 50-period, and 200-period moving averages.
Our weekly resistance levels are at 1.0641 and 1.0786, with support levels at 1.0476 and 1.0296.
On the daily timeframe, the Stochastic Indicator is advancing within the middle range, while the price is trading above the 20-period moving average but remains below the 50-period and 200-period moving averages.
Our daily resistance levels are at 1.0630 and 1.0696, while the support levels are at 1.0523 and 1.0452.
Conclusion: We anticipate a week of high volatility for EURUSD, with the market keenly observing any updates on the war conditions in the Middle East. Additionally, the ECB rate decision will be another focal point. We expect the EURUSD to trend slightly upwards, potentially reaching our resistance level at 1.0630.
DJ30
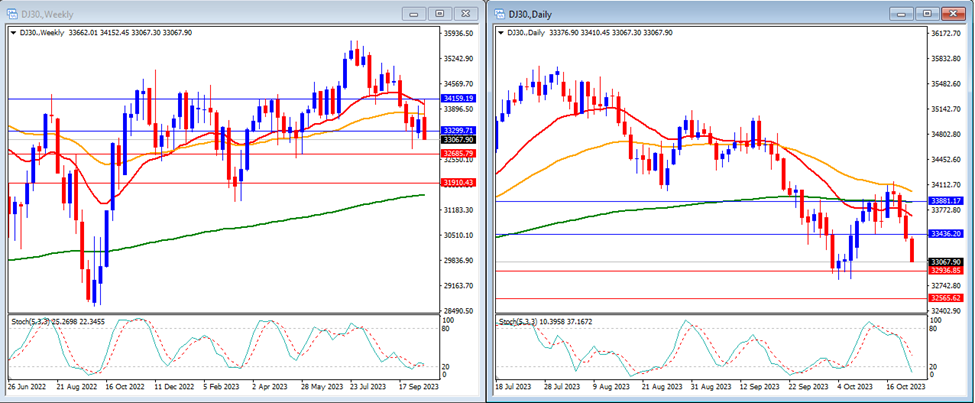
Last week, the DJ30 moved lower and managed to break below our support level. The DJ30 closed the week at 33,067.
On the weekly timeframe, we can see that the Stochastic Indicator is moving lower, targeting the oversold area. The price is currently trading below the 20 and 50-period moving averages but remains above the 200-period moving average.
Our weekly resistance levels are at 33,067 and 34,159, with support levels at 32,685 and 31,910.
On the daily timeframe, the Stochastic Indicator is trending lower, aiming for the oversold area. The price is currently trading below the 20, 50, and 200-period moving averages.
Our daily resistance levels are 33,436 and 33,881, with support levels at 32,936 and 32,565.
Conclusion: The US stock market is expected to experience a week of high volatility due to earnings reports from several companies. Additionally, the release of Flash Manufacturing and Services PMI data will serve as a significant market mover. We anticipate that the DJ30 may trend downward as the market continues to weigh the safe-haven status of the US Dollar. Our potential target is our support level at 32,685.
USOUSD
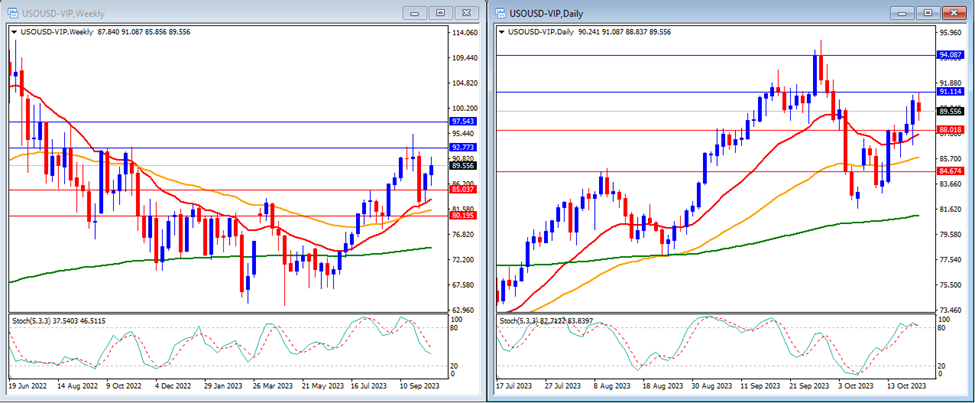
Last week, USOUSD (Oil) moved higher and managed to break above our daily resistance levels. The pair closed the week at 89.55.
On the weekly timeframe, we can see that the Stochastic Indicator is currently trending lower within the middle range. The price is trading above the 20-period, 50-period, and 200-period moving averages.
Our weekly resistance levels are 92.77 and 97.54, with support levels at 85.03 and 80.19.
On the daily timeframe, the Stochastic Indicator is positioned within the overbought area. The price is currently trading above the 20, 50, and 200-period moving averages.
Our daily resistance levels are at 91.11 and 94.08, while support levels are at 88.01 and 84.67.
Conclusion: We anticipate further significant movement in USOUSD due to the latest sentiment surrounding Middle East tensions. There’s a possibility of a continued upward trend, with USOUSD potentially reaching our resistance level at 91.11.
NAS100
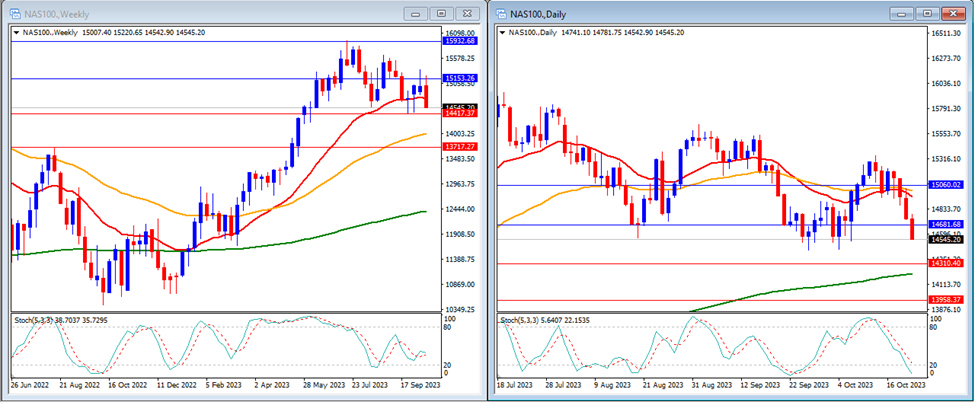
Last week, the NAS100 moved lower and managed to break through our support levels. The NAS100 closed the week at a lower level of 14,545.
On the weekly timeframe, we can see that the Stochastic Indicator is currently flat within the middle range. The price is trading below the 20-period moving average but remains above the 50 and 200-period moving averages.
Our weekly resistance levels are 15,153 and 15,932, with support levels at 14,417 and 13,717.
On the daily timeframe, the Stochastic Indicator is trending lower and entering the oversold area. The price is currently trading below the 20 and 50-period moving averages but remains above the 200-period moving average.
Our daily resistance levels are currently at 14,681 and 15,060, while support levels are at 14,310 and 13,958.
Conclusion: The US stock market is poised for a week of high volatility owing to earnings reports from several companies. Additionally, the release of the Flash Manufacturing and Services PMI data will act as a key market mover. We anticipate that the NAS100 might trend downward as the market assesses the safe-haven status of the US Dollar. Our potential target is a support level of 14,310.
GBPUSD
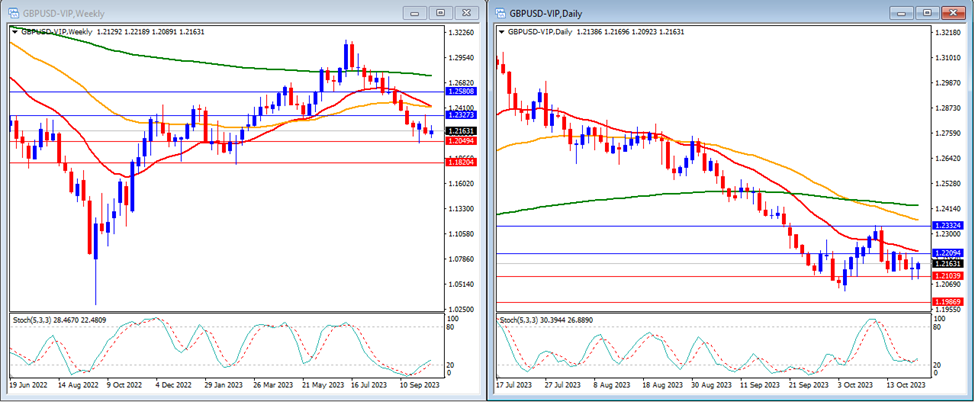
Last week, GBPUSD moved slightly higher but remained in consolidation between our support and resistance levels. GBPUSD closed the week at 1.2163.
On the weekly timeframe, the Stochastic Indicator is currently trending higher, attempting to exit the oversold area. The price is trading below the 20-period, 50-period, and 200-period moving averages.
Our weekly resistance levels are at 1.2327 and 1.2580, while support levels are at 1.2049 and 1.1820.
On the daily timeframe, the Stochastic Indicator is positioned just above the oversold area, while the price is trading below the 20-period, 50-period, and 200-period moving averages.
Our daily resistance levels are now at 1.2209 and 1.2332, while support levels are at 1.2103 and 1.1986.
Conclusion: This week, we anticipate continued low volatility in GBPUSD due to a lack of high-impact news from the UK. We expect GBPUSD to trend downward, with the potential to drop below our support level at 1.2103.
USD Index
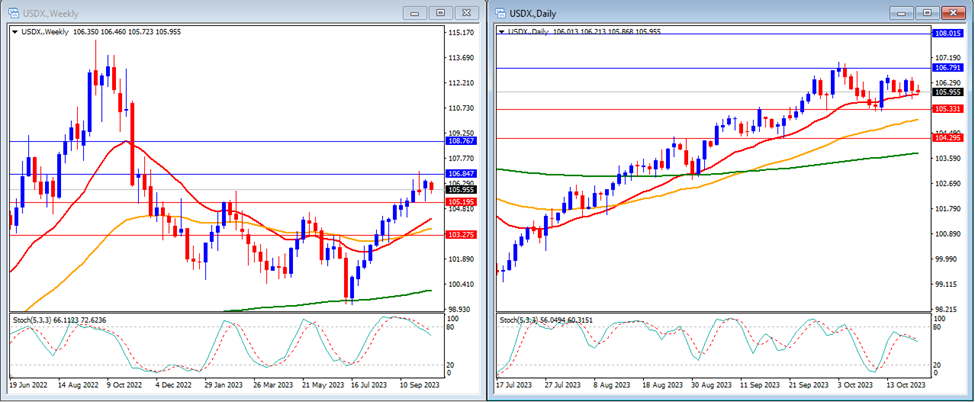
Last week, the USD Index traded marginally lower, remaining consolidated between our support and resistance levels. It closed the week at 105.95.
On the weekly timeframe, the Stochastic Indicator is presently attempting to exit the overbought area. The price is trading above the 20, 50, and 200-period moving averages.
Our weekly resistance levels are 106.84 and 107.98, with support levels at 105.19 and 103.27.
On the daily timeframe, the Stochastic Indicator is positioned close to the overbought area. The price remains above the 20, 50, and 200-period moving averages.
Our daily resistance levels are 106.79 and 108.01, with support levels at 105.33 and 104.29.
Conclusion: This week, we anticipate high volatility in the USD Index due to its safe-haven status. The market is still awaiting updates on the Middle East war, and we also have high-impact news from the US. We expect the USD Index to continue rising and reach our resistance level of 106.79.
USDJPY
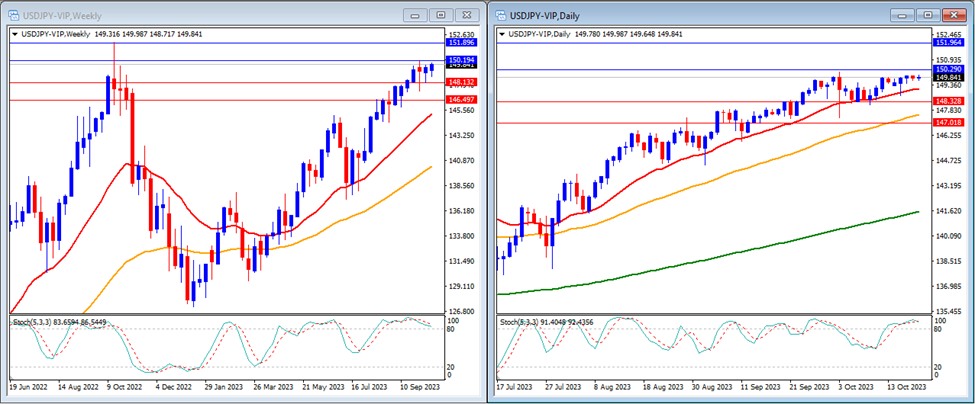
Last week, USDJPY traded marginally higher and has now surpassed our resistance level. It closed the week at 149.84.
On the weekly timeframe, the Stochastic Indicator is positioned within the overbought area. The price is trading above the 20-period, 50-period, and 200-period moving averages.
Our weekly resistance levels are 150.19 and 151.89, with support levels at 148.13 and 146.49.
On the daily timeframe, the Stochastic Indicator is positioned within the overbought area. The price remains above the 20, 50, and 200-period moving averages.
Our daily resistance levels are currently at 150.29 and 151.96, while the support levels are at 148.32 and 147.01.
Conclusion: We anticipate a week of high volatility for USDJPY as the market stays vigilant regarding updates on the Middle East war situation and potential intervention by the Bank of Japan in the currency market. We expect the pair to trend upward, with market sentiment continuing to favor the USD as a safe haven. The pair might potentially surpass our resistance level at 150.29.
Make informed decisions with the most up-to-date and reliable financial data, exclusively provided by vtmarkets.com.