Spreads
Spreads
Spreads
Spreads
Spreads
Make informed decisions with the most up-to-date and reliable financial data, exclusively provided by vtmarkets.com.
EUR/USD Holds Steady Ahead of ECB Meeting and US Economic Indicators
The EUR/USD pair showed a mixed performance as it initially dipped close to weekly lows near 1.0645, surged to 1.0739 – its highest level since Friday – and then retraced back to the 1.0700 range. The pair remained range-bound, eagerly awaiting new catalysts and events scheduled for the following week. The upcoming European Central Bank (ECB) meeting, where a rate hike is expected, will be a crucial event with new forecasts, shaping market expectations for July. Germany’s reported industrial production increase of 0.3% MoM in April fell short of expectations. On Thursday, a fresh estimate of Q1 Euro area GDP and employment change data will be released.
Meanwhile, the US dollar gained momentum after the Bank of Canada’s rate hike and was further supported by surging US bond yields, with the 10-year yield reaching the highest level since May 29. The focus shifts to upcoming events, including the Federal Reserve’s decision on the Fed Fund rate, as well as potential actions from the Reserve Bank of Australia and the impact of US employment data, particularly the crucial Consumer Price Index report on Tuesday and the weekly jobless claims report on Thursday.
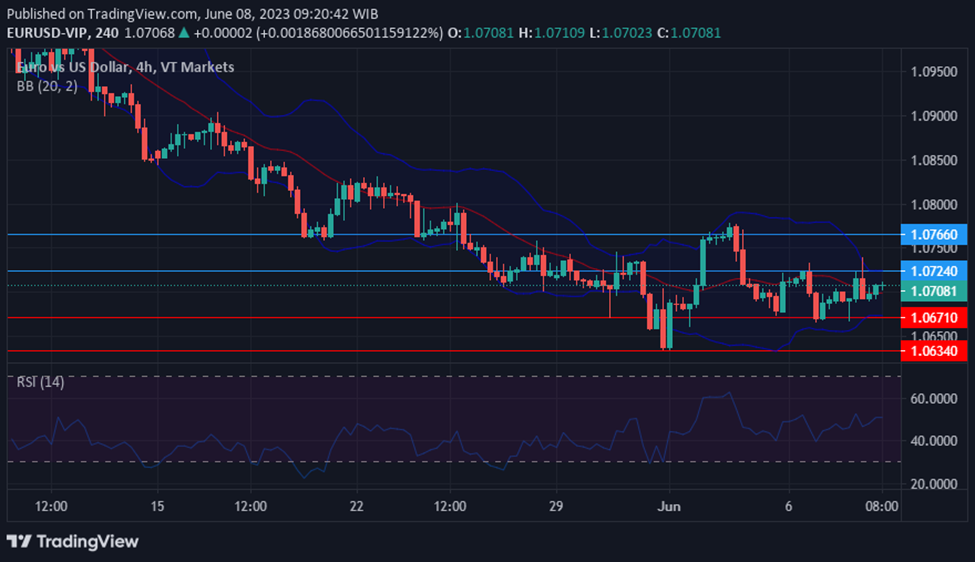
According to technical analysis, the EUR/USD pair moved in flat on Wednesday as we can see that the upper and lower bands is getting narrower. Currently, the EUR/USD is running just above the middle band, with the potential for it to move higher and try to push the upper band of the Bollinger Bands. The Relative Strength Index (RSI) is currently at 50, indicating that the EUR/USD is in a neutral trend.
Resistance: 1.0724, 1.0766
Support: 1.0671, 1.0634
Gold (XAU/USD) Retreats as US Dollar Regains Strength Amid Speculation of Fed Rate Hike
Gold (XAU/USD) experienced a decline after reaching a peak of $1,970.15 per troy ounce, nearing the $1,940 level. The initial weakness of the US Dollar was reversed during the US session, as rising US government bond yields provided support. The speculation surrounding the US Federal Reserve’s potential decision to raise interest rates by 25 basis points next week favored the USD, despite still high odds for no change.
The Bank of Canada’s surprise rate hike and the Reserve Bank of Australia’s recent move cast doubt on the expected end of the tightening cycle in the US. The mixed trading of US stock indexes reflected the uncertainty surrounding the Fed’s next steps, while the 10-year Treasury note and 2-year note yields rose by 8 and 6 basis points, respectively.
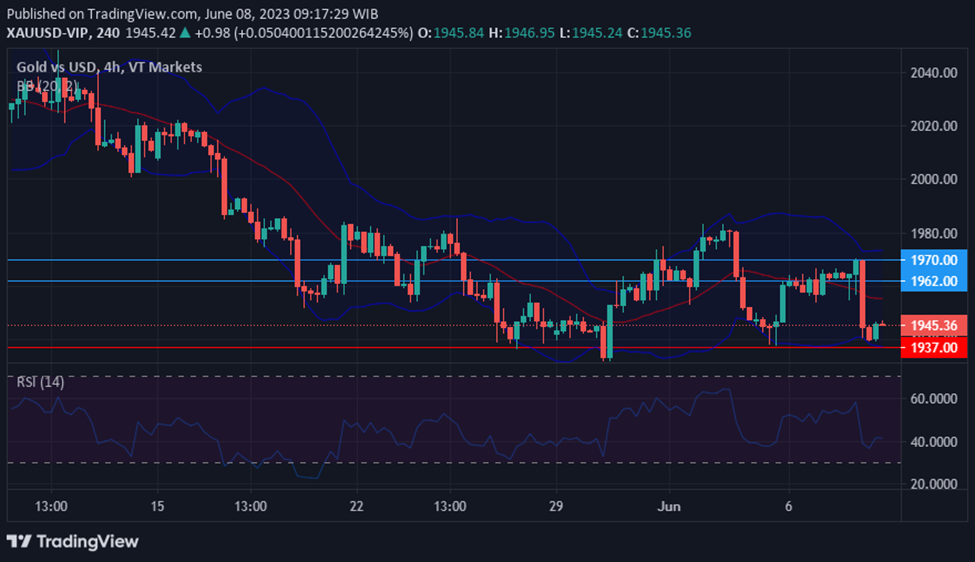
According to technical analysis, the XAU/USD pair is moving higher in the early session on Wednesday but then drop to break our support level in the US session and reach the lower band of the Bollinger Bands. There is a possibility that the XAU/USD will moves back higher for today and try to reach the middle band of the Bollinger Bands. Currently, the Relative Strength Index (RSI) is at 41, suggesting that the XAU/USD is in a slight bearish tone.
Resistance: $1,962, $1,970
Support: $1,937, $1,927
Make informed decisions with the most up-to-date and reliable financial data, exclusively provided by vtmarkets.com.