Spreads
Spreads
Spreads
Spreads
Spreads
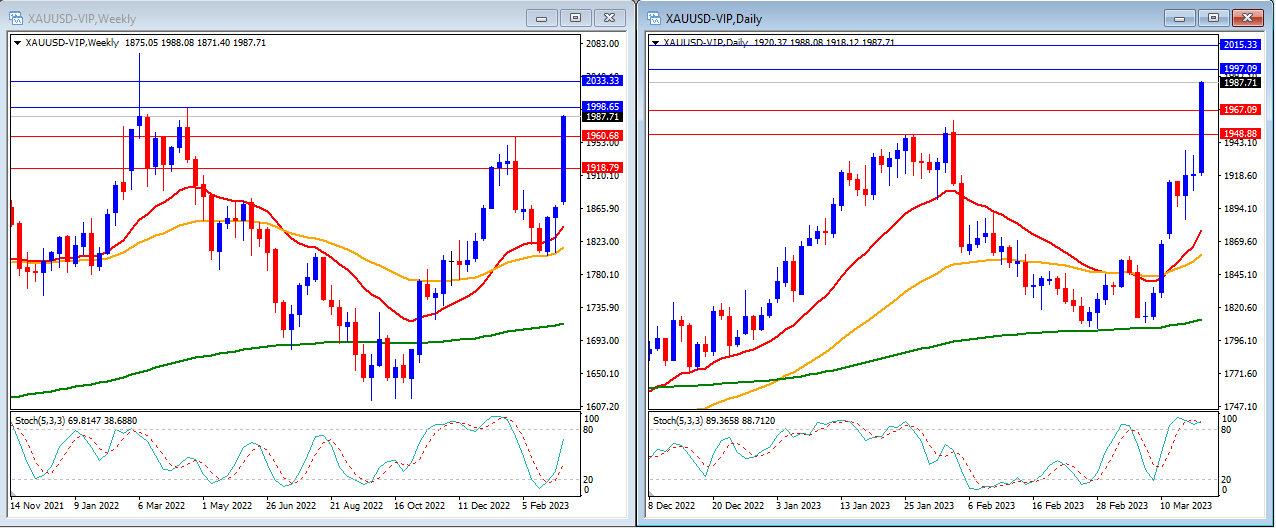
Last week, gold was able to break through our resistance levels and complete the week at $1,987 as the market switched its risk-off attitude in response to some bank problems in the US.
On the weekly timeframe, we can see that the Stochastic Indicator is strongly higher in the middle. The gold price is moving above the 20, 50, and 200-period moving averages.
Our weekly resistance levels are now at $1,998 and $2,033 with the support levels at $1,960 and $1,918.
Meanwhile, on the daily timeframe, the Stochastic Indicator is now inside the overbought level. The price is now moving above the 20, 50, and 200-period moving averages.
Our daily resistance levels are at $1,997 and $2,015, with the support levels at $1,967 and $1,948.
Conclusion: This week, we will see yet another jam-packed data release as the US holds its FOMC meeting to set interest rates. Markets expect the rates to rise. We anticipate that gold may advance further and cross above $2,000.
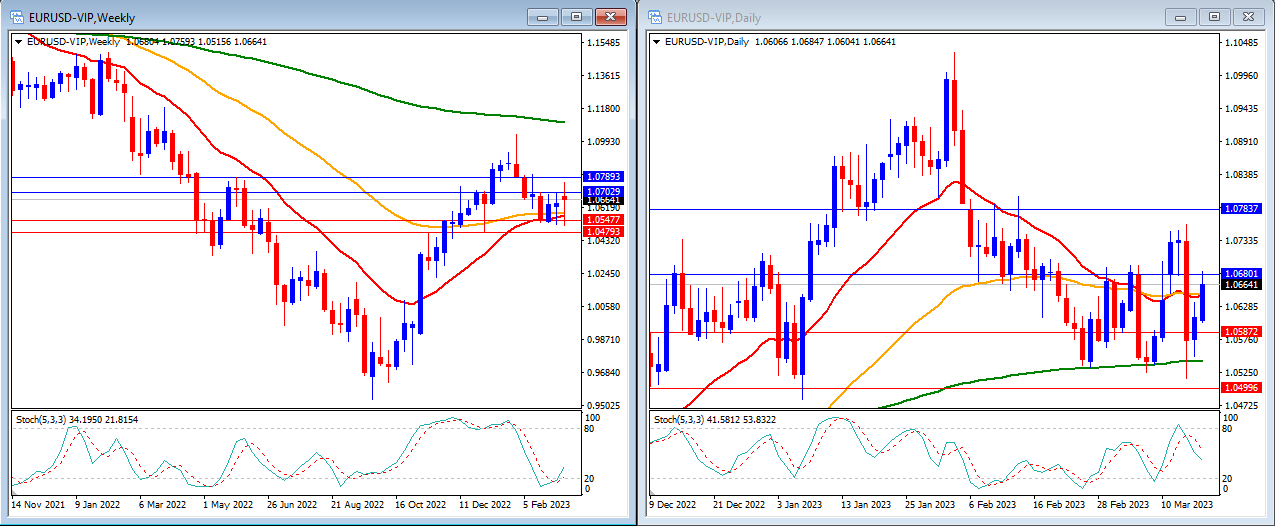
Last week, EURUSD was able to move lower to our support level as expected, but then ended the week higher and reached our resistance level. EURUSD closed the week slightly lower at 1.0664.
On the weekly timeframe, the Stochastic Indicator is exiting the oversold level. The price is still trading below the 200-period moving average and just above the 20 and 50-period moving averages.
Our weekly resistance levels are at 1.0702 and 1.0789, with support levels at 1.0547 and 1.0479.
On the daily timeframe, the Stochastic Indicator is crossing back lower in the middle. The price is moving around the 20 and 50-period moving averages, and above the 200-period moving average.
Our daily resistance levels are at 1.0680 and 1.0783, while the support levels are at 1.0587 and 1.0499.
Conclusion: The US release of its interest rate will be a market mover this week. We expect that EURUSD may move higher to reach our resistance level at 1.0789.

Last week, the DJ30 moved lower as expected and was able to reach our support level at 31795. The DJ30 closed the market at 31820.
On the weekly timeframe, we can see that the Stochastic Indicator is trying to enter the oversold level. The price is moving below the 20 and 50-period moving averages but is still above the 200-period moving average.
Our weekly resistance levels are at 32768 and 33776, with support levels at 31663 and 30919.
In the daily timeframe, we can see that the stochastic indicator is moving higher in the middle. The price is moving below the 20, 50, and 200-period moving averages.
Our daily resistance levels are at 32553 and 33472, with support levels at 31795 and 31178.
Conclusion: With the US will releasing its interest rate, we expect the DJ30 to continue to move lower. We anticipate that the DJ30 may reach our next support level at 30919.
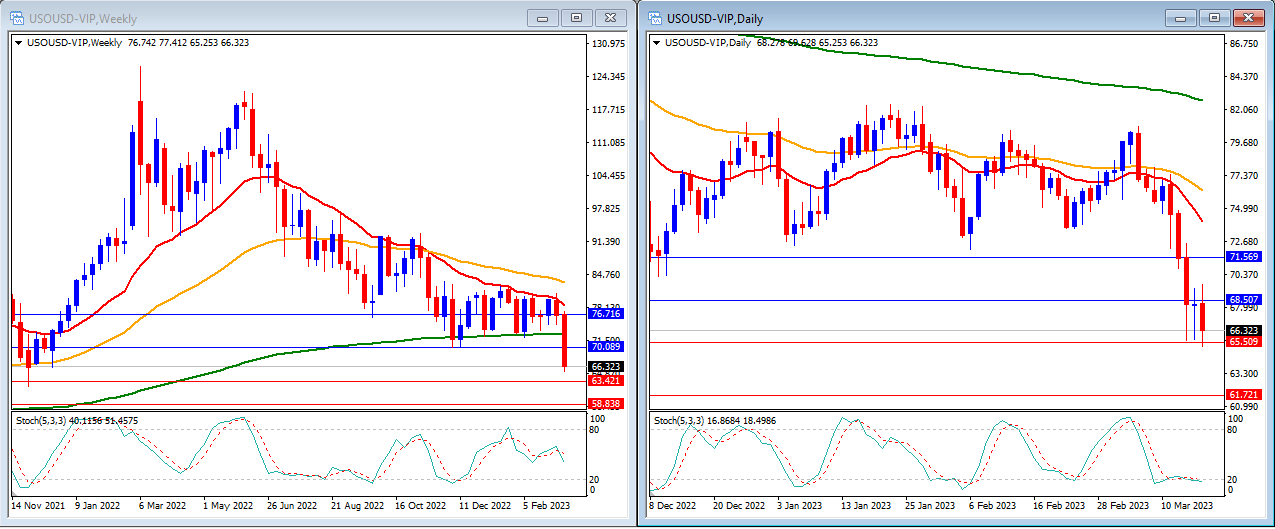
Last week, USOUSD (Oil) prices fell and broke our support levels due to some concerns in the global market related to the banking sector in the US. USOUSD closed the week at 66.32.
On the weekly timeframe, the Stochastic Indicator is still in the middle with no clear direction. The price is moving below the 20, 50, and 200-period moving averages.
Our weekly resistance levels are at 70.08 and 76.71, with support levels at 63.42 and 58.38.
On the daily timeframe, the Stochastic Indicator is moving just around the oversold level. Price moves below the 20, 50, and 200-period moving averages.
Our daily resistance levels are at 68.57 and 71.56, while support levels are at 65.50 and 61.72.
Conclusion: Despite the reopening of China’s economy and sanctions against Russian oil and gas, stockpiles have increased. This contributed to the bearish move, exacerbating concerns over waning demand. We expect USOUSD to continue to move lower and may try to reach our next support level at 63.42.
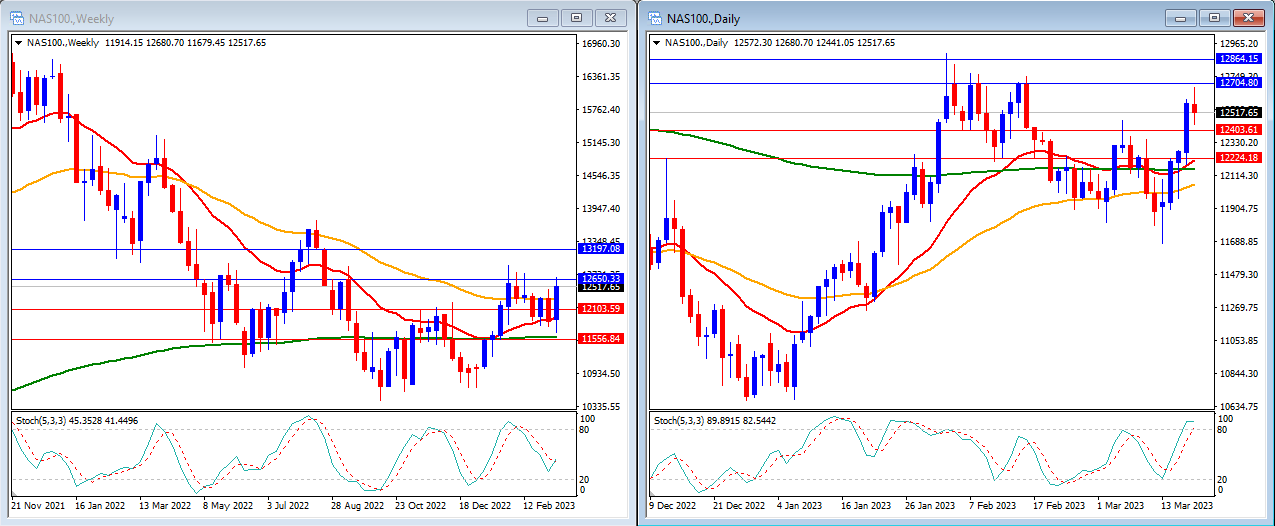
Last week, the NAS100 moved higher as investors took their chances on the technology side and other growth names ahead of this week’s Federal Reserve policy meeting. The NAS100 closed the market at 12517.
On the weekly timeframe, the Stochastic Indicator is moving in the middle. The price is currently above the 20, 50, and 200-period moving averages.
Our weekly resistance levels are at 12650 and 13197, with support levels at 12103 and 11556.
On the daily timeframe, the stochastic indicator is moving higher entering the overbought level. The price is now trading above the 20, 50, and 200-period moving averages.
Our daily resistance levels are currently at 12704 and 12864, while support levels are at 12403 and 12224.
Conclusion: We expect the NAS100 to move back lower. We anticipate that the NAS100 may reach our support level at 12103.
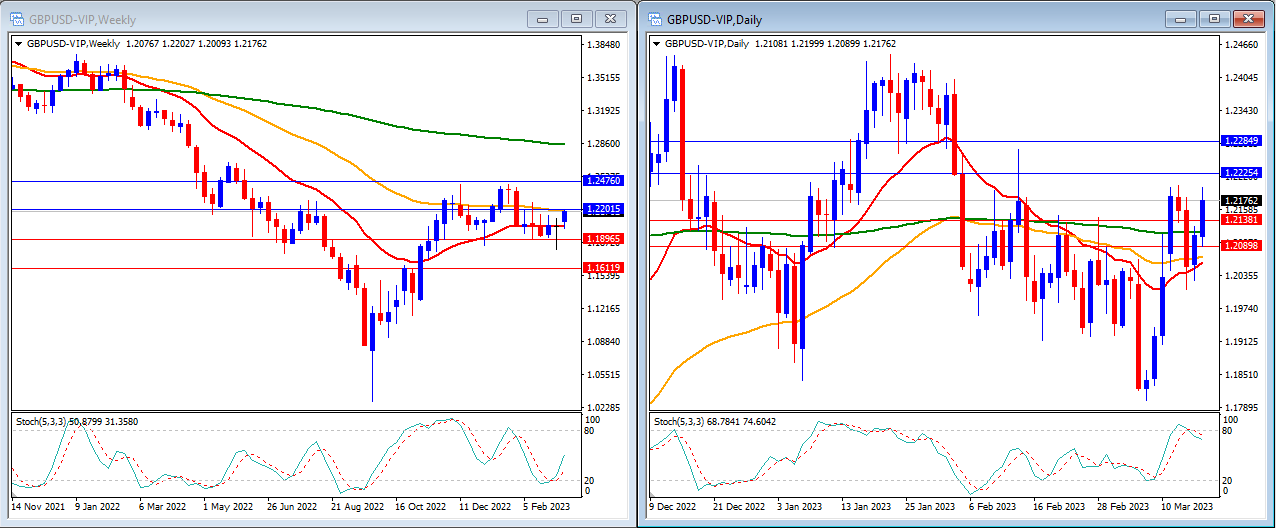
Last week, GBPUSD was able to move higher as high as expected and able to reach near the 1.2200 level. GBPUSD is closing the week at 1.2176.
On the weekly timeframe, the Stochastic Indicator is moving higher after exiting the oversold level, and the price is now moving above the 20-period moving average and below the 50 and 200-period moving averages.
Our weekly resistance levels are at 1.2201 and 1.2476, while support levels are at 1.1896 and 1.1611.
On the daily timeframe, our stochastic indicator is moving lower after reaching the overbought level. The price is above the 20, 50, and 200-period moving averages.
Our daily resistance levels are now at 1.2225 and 1.2284, while support levels are at 1.2138 and 1.2089.
Conclusion: With the Bank of England and the Fed releasing their interest rates this week, we are expecting significant volatility in GBPUSD. We anticipate the pair to move slightly higher and reach our resistance level at 1.2225.
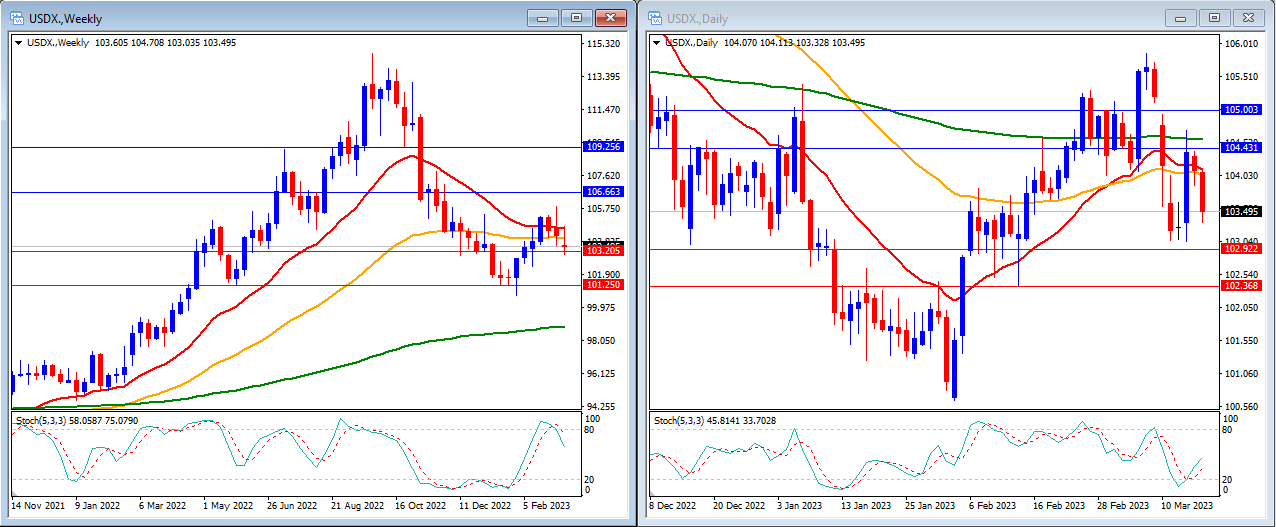
Last week, the USD Index moved slightly lower as the market awaited this week’s FOMC meeting, following the release of CPI data as expected. The USD Index moved slightly lower and closed the week at 103.49.
On the weekly timeframe, we can see that the Stochastic Indicator is exiting the overbought level. Price is moving just below the 20 and 50-period moving averages but still above the 200-period moving average.
Our weekly resistance levels are at 106.67 and 109.25 with the support levels at 103.20 and 101.25.
On the daily timeframe, the Stochastic Indicator is moving higher exiting the oversold level. Price is now moving below the 20, 50, and 200-period moving averages.
Our daily resistance levels are at 104.43 and 105.00 with the support levels at 102.92 and 102.36.
Conclusion: This week, the USD Index will likely experience high volatility as the Fed will release its interest rates. We anticipate USD Index to move higher to reach our resistance level of 104.43.
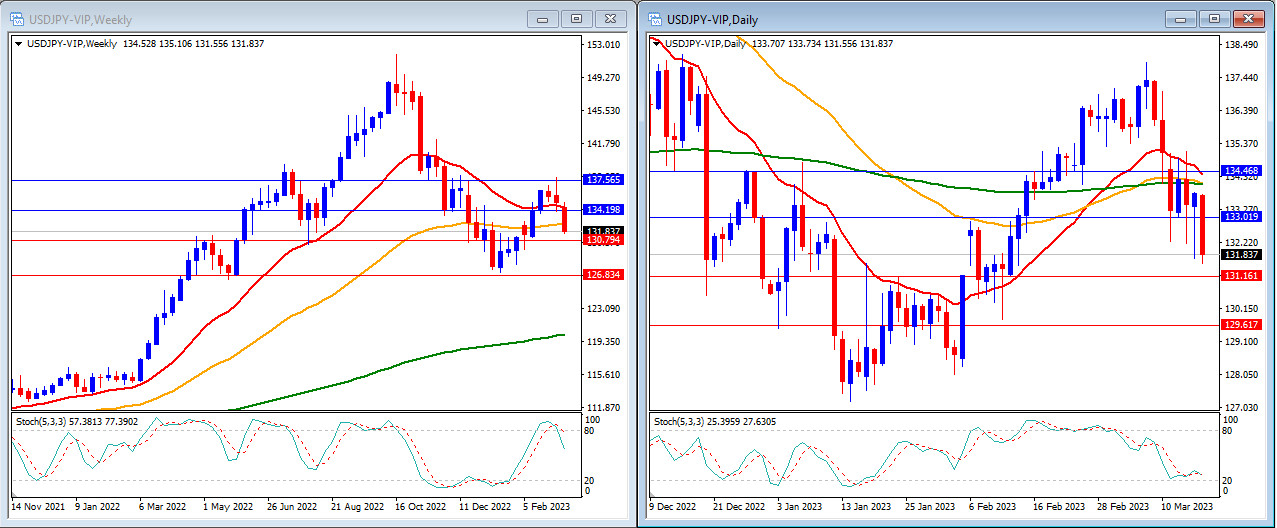
Last week, USDJPY moved lower affected by the weak US Dollar. USDJPY closed the week at 131.83.
On the weekly timeframe, we can see that the Stochastic Indicator is now exited the overbought level. The price is moving below the 20, and 50-period moving averages and still above the 200-period moving average.
Our weekly resistance levels are at 134.18 and 137.56, with the support levels at 130.79 and 126.83.
On the daily timeframe, the stochastic indicator is moving lower near the oversold level. Price is moving below the 20, 50, and 200-period moving averages.
Our daily resistance levels are now at 133.01 and 134.46, while the support levels are at 131.16 and 129.61.
Conclusion: This week, we will have the US interest rate decision by the Fed which will move the USDJPY. We expect the pair to continue to move lower and reach our next support level at 131.16.
Make informed decisions with the most up-to-date and reliable financial data, exclusively provided by vtmarkets.com.