Spreads
Spreads
Spreads
Spreads
Spreads
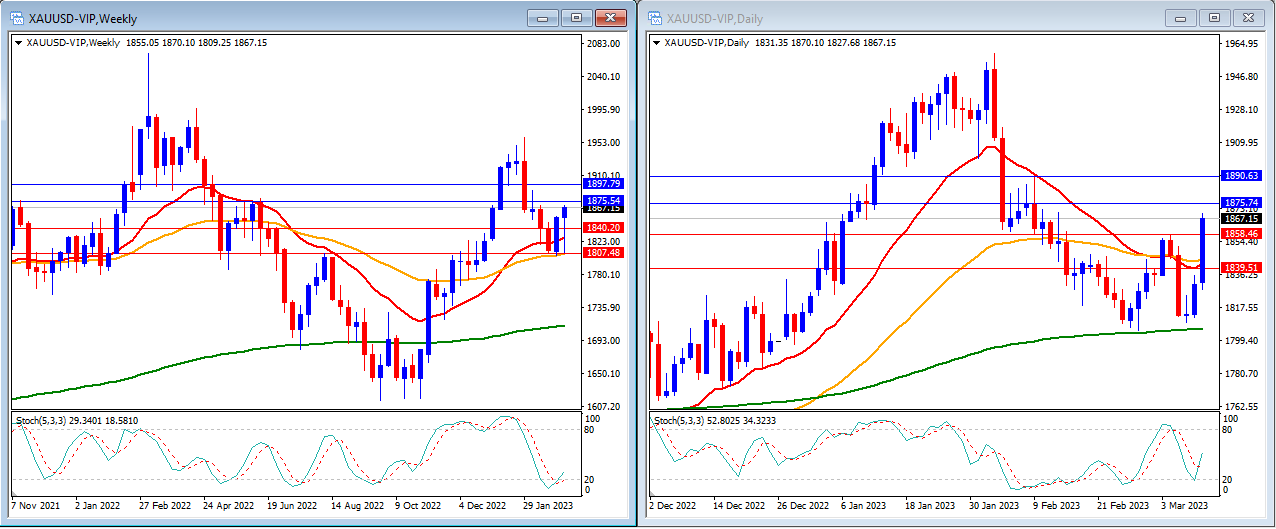
Last week, as anticipated, gold saw an increase, but it fell short of reaching our top resistance level of $1,890. Instead, it managed to climb to our first resistance level of $1,866 before ending the week at $1,867.
On the weekly timeframe, we can see that the Stochastic Indicator is exiting the oversold level with the potential of moving higher. The gold price is currently moving above the 20, 50, and 200-period moving averages.
Our weekly resistance levels are now at $1,875 and $1,897 with the support levels at $1,840 and $1,807.
Meanwhile, on the daily timeframe, the Stochastic Indicator is crossing back higher near the oversold level. The price is now moving above the 20, 50, and 200-period moving averages.
Our daily resistance levels are at $1,875 and $1,890, with the support levels at $1,858 and $1,839.
Conclusion: This week, we will have another packed data release, as the US will release their inflation data in CPI and PPI, with the addition of Retail Sales data which may create some high volatility in gold. For this week, we expect that gold may continue to move slightly higher to reach our resistance level at $1,875 before going back lower if the inflation data is released higher.
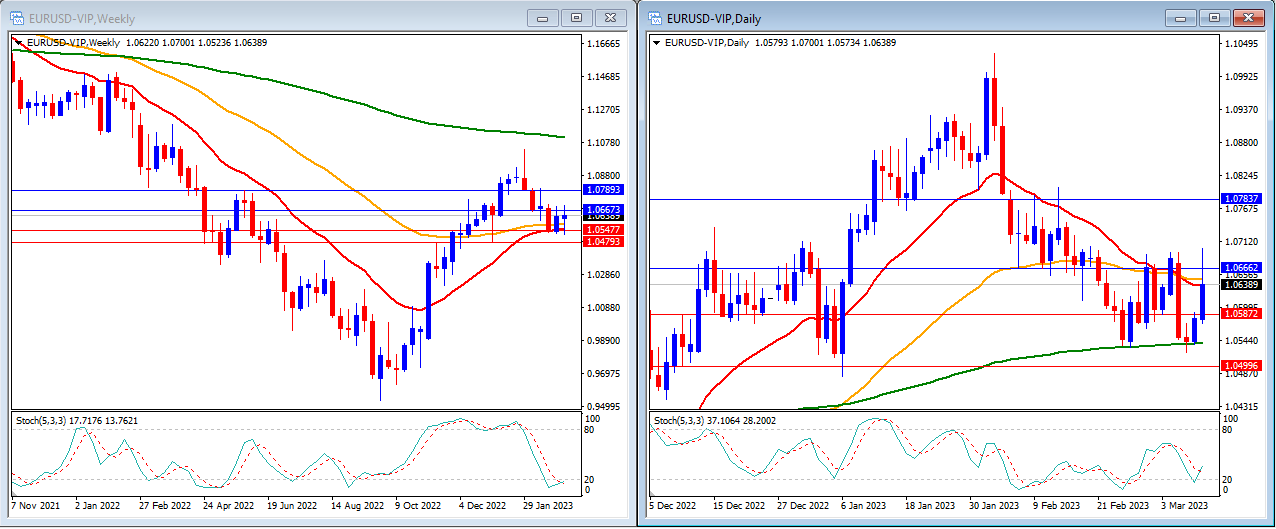
Last week, EURUSD was able to end the week higher and reached our resistance level at 1.0667. EURUSD closed the week slightly higher at 1.0638.
On the weekly timeframe, the Stochastic Indicator is inside the oversold level. The price is still trading below the 200-period moving average and just above the 20 and 50-period moving averages.
Our weekly resistance levels are at 1.0667 and 1.0789, with support levels at 1.0547 and 1.0479.
On the daily timeframe, the Stochastic Indicator is crossing back higher just above the oversold level. The price is moving at the 20 and 50-period moving averages, and above the 200-period moving average.
Our daily resistance levels are at 1.0666 and 1.0783, while the support levels are at 1.0587 and 1.0499.
Conclusion: US inflation data in CPI and PPI will be the leading market mover this week. We expect EURUSD to move lower to reach our support level at 1.0587.
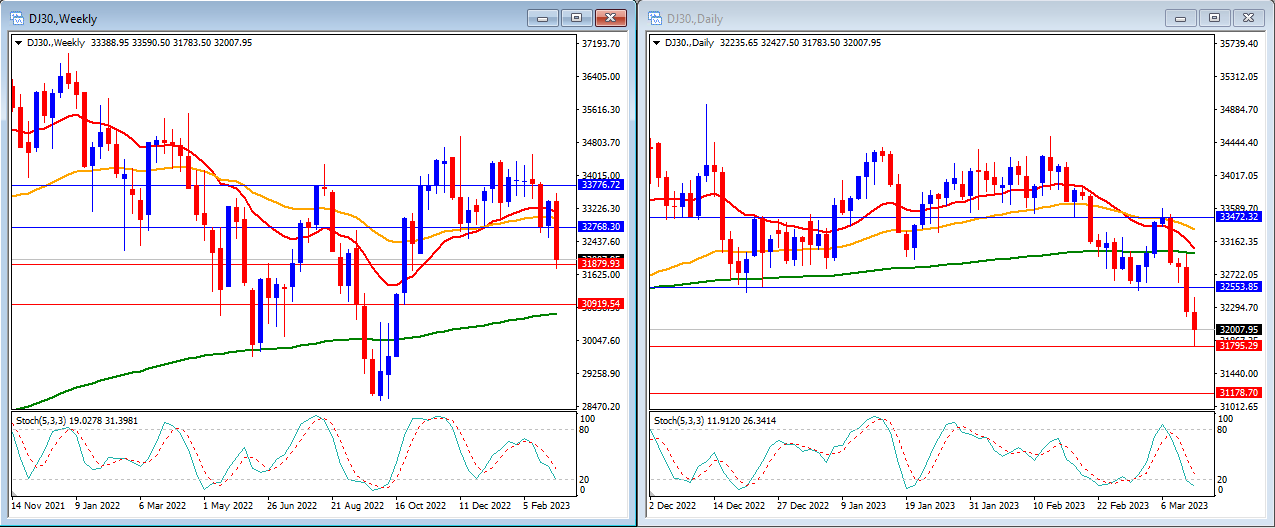
Last week, the DJ30 moved lower as expected and was able to break our support levels affected by Silicon Valley Bank’s closure due to bond portfolio losses. The DJ30 closed the market at 32007.
On the weekly timeframe, we can see that the Stochastic Indicator is moving lower in the middle. The price is moving below the 20 and 50-period moving averages but is still above the 200-period moving average.
Our weekly resistance levels are at 32768 and 33776, with support levels at 31879 and 30919.
In the daily timeframe, we can see that the stochastic indicator is moving lower, targeting the oversold level. The price is moving above the 20, 50 and 200-period moving averages.
Our daily resistance levels are at 32553 and 33472, with support levels at 31795 and 31178.
Conclusion: With the US releasing their inflation data for this week and the market continuing to be looking at the SVB’s update, we expect the DJ30 to continue to move lower. We anticipate DJ30 to reach our support level at 31795.

Last week, USOUSD (Oil) prices reached higher on the first day of last week, but were unable to keep stronger and goes lower to close the week at 76.58.
On the weekly timeframe, the Stochastic Indicator is still in the middle with no clear direction. The price is moving below the 20 and 50-period moving averages but above the 200-period moving average.
Our weekly resistance levels are at 80.21 and 83.52, with support levels at 73.40 and 69.19.
On the daily timeframe, the Stochastic Indicator is moving strongly lower targeting the oversold level. Price moves below the 20, 50 and 200-period moving averages.
Our daily resistance levels are at 77.43 and 80.51, while support levels are at 75.25 and 73.18.
Conclusion: With some unclear information about export cuts in Russia and China’s demands, we expect USOUSD to continue to move in the range between our weekly support and resistance levels at 73.40 and 80.
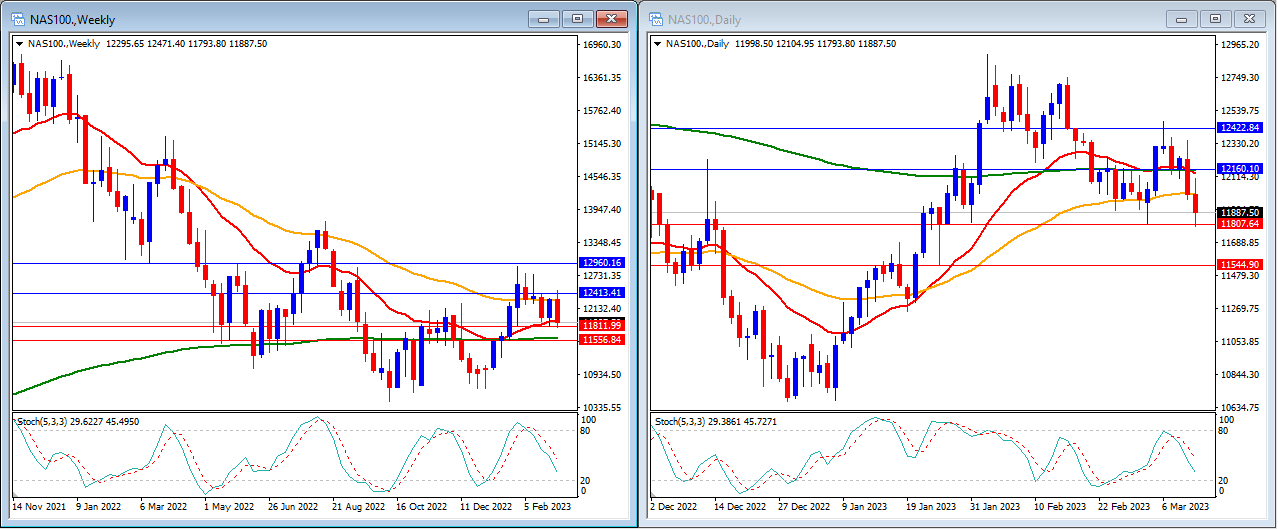
Last week, the NAS100 moved lower as expected and was able to break our support levels affected by Silicon Valley Bank’s closure due to bond portfolio losses. The NAS100 closed the market at 11887.
On the weekly timeframe, the Stochastic Indicator is moving lower in the middle. The price is currently hovering around the 20-period moving average, below the 50-period moving average but remains above the 200-period moving average.
Our weekly resistance levels are at 12413 and 12960, with support levels at 11811 and 11556.
On the daily timeframe, the stochastic indicator is moving lower in the middle. The price is now trading below the 20, 50, and 200-period moving averages.
Our daily resistance levels are currently at 12160 and 12422, while support levels are at 11807 and 11544.
Conclusion: With the US releasing its inflation data for this week and the market continuing to be looking at the SVB’s update, we expect the NAS100 to continue to move lower. We anticipate NAS100 to reach our support level at 11544.

Last week, GBPUSD moved lower in the early week, but then ended the week higher back to a similar price as the weekly open price. GBPUSD currently closes the week at 1.2031.
On the weekly timeframe, the Stochastic Indicator is moving at the oversold level, and the price is now moving at the 20-period moving average and below the 50 and 200-period moving averages.
Our weekly resistance levels are at 1.2201 and 1.2476, while support levels are at 1.1896 and 1.1611.
On the daily timeframe, our stochastic indicator is starting to move higher just above the oversold level. The price is above the 20-period moving average but still below the 50, and 200-period moving averages.
Our daily resistance levels are now at 1.2079 and 1.2126, while support levels are at 1.1966 and 1.1911.
Conclusion: With UK Claimant Count Change, annual budget and US inflation data being released this week, we anticipate GBPUSD to move slightly higher and reach our resistance levels at 1.2126.

Last week, the USD Index moved lower as the jobs data was released not in favour of the US dollar. The USD Index moved slightly lower and closed the week at 104.18.
On the weekly timeframe, we can see that the Stochastic Indicator is entering the overbought level. Price is moving between the 20 and 50-period moving averages but still above the 200-period moving average.
Our weekly resistance levels are at 106.67 and 109.25 with the support levels at 103.20 and 101.25.
On the daily timeframe, the Stochastic Indicator is moving lower just below the overbought level. Price is now moving between the 20 and 50-period moving averages but just below the 200-period moving average.
Our daily resistance levels are at 105.00 and 105.79 with the support levels at 103.66 and 102.92.
Conclusion: This week, the USD Index will likely experience volatility as the US will release its inflation data in CPI and PPI with the addition of Retail sales data. We anticipate the USD Index to move higher to reach our resistance levels at 105.00.
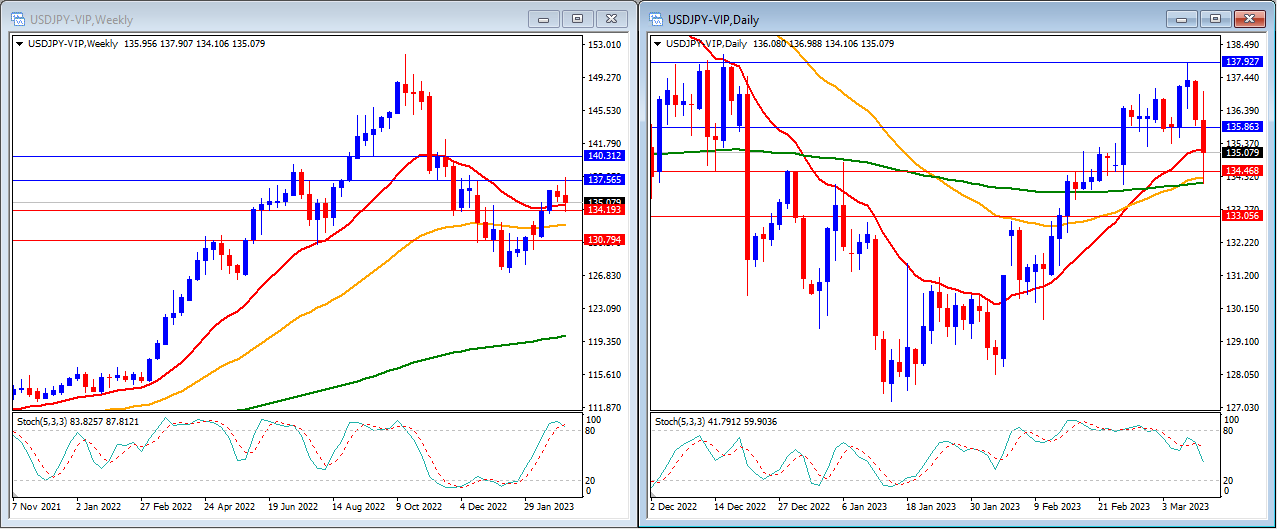
Last week, USDJPY moved slightly lower due to the weaker US jobs data, closing the week at 135.07.
On the weekly timeframe, we can see that the Stochastic Indicator is now inside the overbought level. The price is moving above the 20, 50 and 200-period moving averages.
Our weekly resistance levels are at 137.56 and 140.31, with the support levels at 134.19 and 130.79.
On the daily timeframe, the stochastic indicator is moving slightly lower in the middle. Price is moving at the 20-period moving average, but still above the 50 and 200-period moving averages.
Our daily resistance levels are now at 135.86 and 137.92, while the support levels are at 134.46 and 133.05.
Conclusion: This week, the US will release its CPI and PPI data which will move the market. We expect USDJPY to move slightly higher to reach our resistance level at 135.86.
Make informed decisions with the most up-to-date and reliable financial data, exclusively provided by vtmarkets.com.