Spreads
Spreads
Spreads
Spreads
Spreads
EURUSD (4-Hour Chart)
The EURUSD lost bullish momentum and retreated below the 1.0600 level in the US trading session after touching a daily high of around 1.0650 level. The US Consumer Confidence Survey declined to 6.3% in February from 6.7% in January, however, failing to provide a robust boost for the pair. Now, the effects of rate hikes have not yet shown up because of the usual lags in their impact. This will change and price pressures will then ease noticeably as the year progresses. If this does not happen, and the Fed has not cooled demand sufficiently, then we can expect there will be more rate hikes than previously the market anticipated. In Eurozone, Spanish, and French inflation figures came in above market expectations in February, according to preliminary estimates. At the time being, speculative interest pricing in rate hikes will continue until early 2024, while the ECB’s terminal rate is currently seen at 4%.
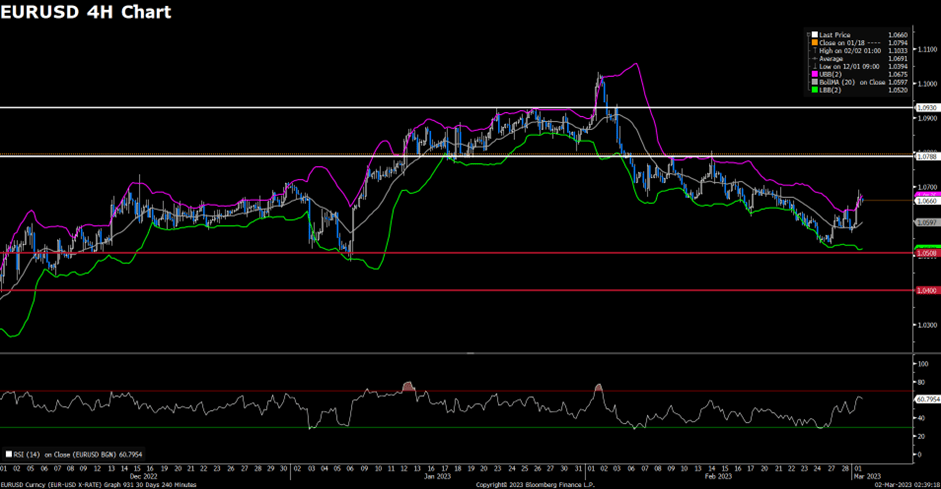
From a technical perspective, the four-hour scale RSI indicator slid below the midline, suggesting that bearish momentum triggered by US data failed to sustain in the middle of the US trading hour and also showed that the pair currently have no clear moving path. As for the Bollinger Bands, the pair was capped by the upper band around the 1.0640 level and trading in the upper area, indicating the pair was more favored to hover in a range from 1.0580 to 1.0650.
Resistance: 1.0788, 1.0929
Support: 1.0508, 1.0400
XAUUSD (4-Hour Chart)
The XAUUSD recovered further on Tuesday and was trading around the $1830 mark as of writing, as the US Dollar turned south during the American trading hour. The greenback was hit by the Conference Board Consumer Confidence Index as it fell for a second consecutive month in February, printing at 102.9 against the 108.5 anticipated by market players. Moreover, the Expectations Index fell further to 69.7 from a downwardly revised 76.0 in January. A reading below 80 often signals a recession within the next year, according to the official report. Meanwhile, the US equity market was trading with a mixed tone, the Nasdaq held on to modest intraday gains, while the Dow Jones Industrial Average witnessed heavy selling transactions for a second consecutive day. Meanwhile, US government bond yields ticked north. Early news indicating increased inflationary pressures in Spain and France spurred speculation the European Central Bank (ECB) will maintain its monetary tightening policy until early 2024, while the terminal rate is now seen at 4%.
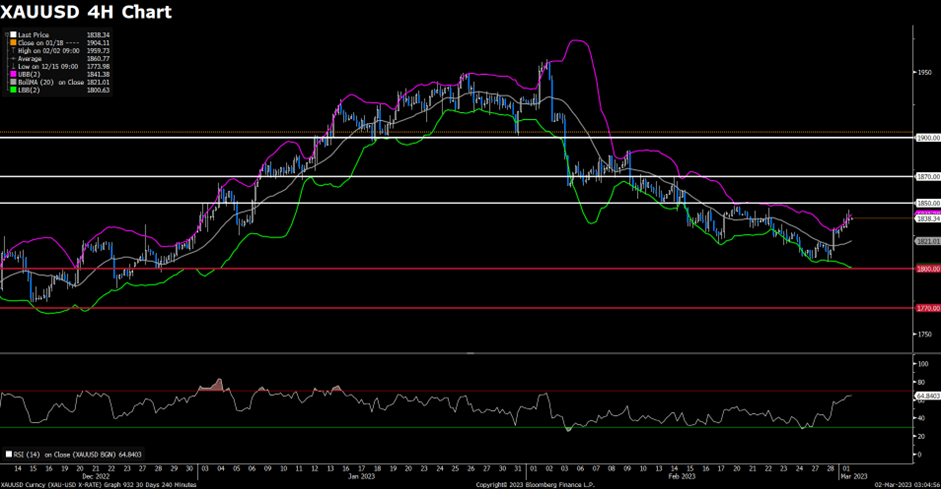
From a technical perspective, the four-hour scale RSI indicator surged to 58 figures, suggesting that the pair were surrounded by strong bearish traction. As for the Bollinger Bands, the pair was capped by the upper band at the moment of writing, if the price could break through the upper band, the bull could target the next resistance of the $1850 mark.
Resistance: 1850, 1870, 1900
Support: 1820, 1800