Spreads
Spreads
Spreads
Spreads
Spreads
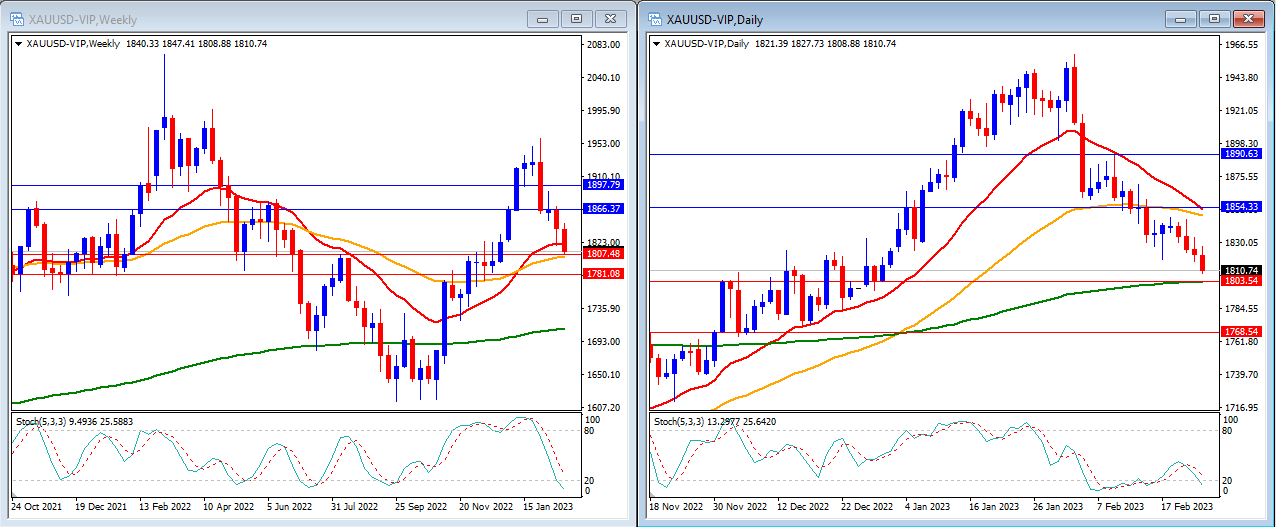
Gold prices declined last week, largely influenced by the US’s release of strong economic data. By the end of the week, gold closed the week at 1810.
On the Weekly timeframe, we can see that the Stochastic Indicator is moving strongly lower, targeting the oversold level. Gold price is still moving between the 20 and 50-period moving averages but still above the 200-period moving average.
Our Weekly resistance levels are at $1,866 and $1,897, with the support levels at $1,807 and $1,781.
The Stochastic Indicator is moving near the oversold level on the Daily timeframe. The price is moving below the 20 and 50-period moving averages but still above the 200-period moving averages.
Our Daily resistance levels are at $1,854 and $1,890, with the support levels at $1,803 and $1,768.
Conclusion: There is little high-impact news to report this week. Our analysis suggests that gold may experience a moderate upward trend, with a possible resistance level of $1,854.
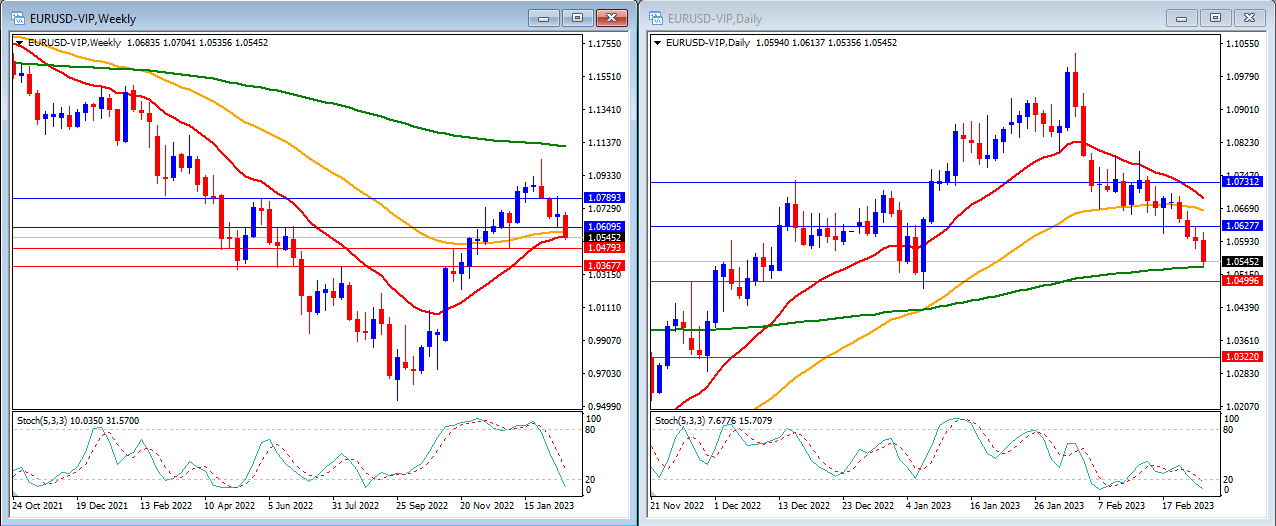
Last week, EURUSD reached our support level at 1.0554, as expected. EURUSD closed the week slightly higher at 1.0545.
The Stochastic Indicator is strongly lower on our Weekly timeframe, targeting the oversold level. The price continues to trade below the 200-period moving average and just around the 20 and 50-period moving averages.
Our Weekly resistance levels are at 1.0609 and 1.0789, with the support levels at 1.0479 and 1.0367.
Our Daily timeframe shows that our Stochastic Indicator is moving flat inside the oversold level. The price is moving below the 20 and 50-period moving averages while still just above the 200-period moving averages.
Our Daily resistance levels are at 1.0627 and 1.0731, while the support levels are at 1.0499 and 1.0322.
Conclusion: This week, we only have a few high-impact data from the US and the EU. We forecast EURUSD to move slower but still try to reach our next support level below 1.0500.

Last week, DJ30 dropped after Fed members said they are still considering raising more interest rates to lower the inflation to their target. DJ30 closed the market at 32672.
On the Weekly timeframe, the Stochastic Indicator is starting to cross lower in the middle. Price is moving below the 20, and 50-period moving averages but still above the 200-period moving average.
Our Weekly resistance levels are at 33776 and 34497, with the support levels at 32672 and 31879.
Our Daily timeframe shows that our Stochastic Indicator is moving lower, entering the oversold level. The price is moving below the 20, 50, and 200-period moving averages.
Our Daily resistance levels are 32958 and 33487, while the support levels are 32648 and 32170.
Conclusion: DJ30 might move slower this week. We expect that DJ30 may reach our support level at 32648.

The past week saw USOUSD trade within a narrow range with relatively low volatility. The week ended with USOUSD closing at 76.26.
On the Weekly timeframe, we can see that the Stochastic Indicator is still moving in the middle with NO clear direction. The price is moving below the 20 and 50-period moving averages and above the 200-period moving averages.
Our Weekly resistance levels are at 78.77 and 82.42, with the support levels at 73.40 and 69.60.
On our Daily timeframe, we can see that our Stochastic Indicator is moving around the oversold level. The price moves below the 20, 50 and 200-period moving averages.
Our Daily resistance levels are at 77.42 and 80.06, while the support levels are at 75.25 and 73.19.
Conclusion: Market sentiments are still in the mix for the oil market. This week, we anticipate that the USOUSD may continue to rise, with a target of reaching our resistance levels at 77.42.

Last week, NAS100 dropped for the week after some mixed reactions from the FOMC meeting minutes. NAS100 closed the week at 11973.
On the Weekly timeframe, we can see that the Stochastic Indicator is exiting the overbought level. The price is moving below the 50-period moving average but still above the 20 and 200-period moving averages.
Our Weekly resistance levels are at 12413 and 12960, with the support levels at 11811 and 11556.
On our daily timeframe, we can see that our Stochastic Indicator is moving inside the oversold level. The price is moving just around the 50-period moving average and below the 20 and 200-period moving averages.
Our Daily resistance levels are now at 12224 and 12422, while the support levels are at 11768 and 11556.
Conclusion: NAS100 might move slower this week. We expect NAS100 to try to reach our support levels at 11811 and 11768.
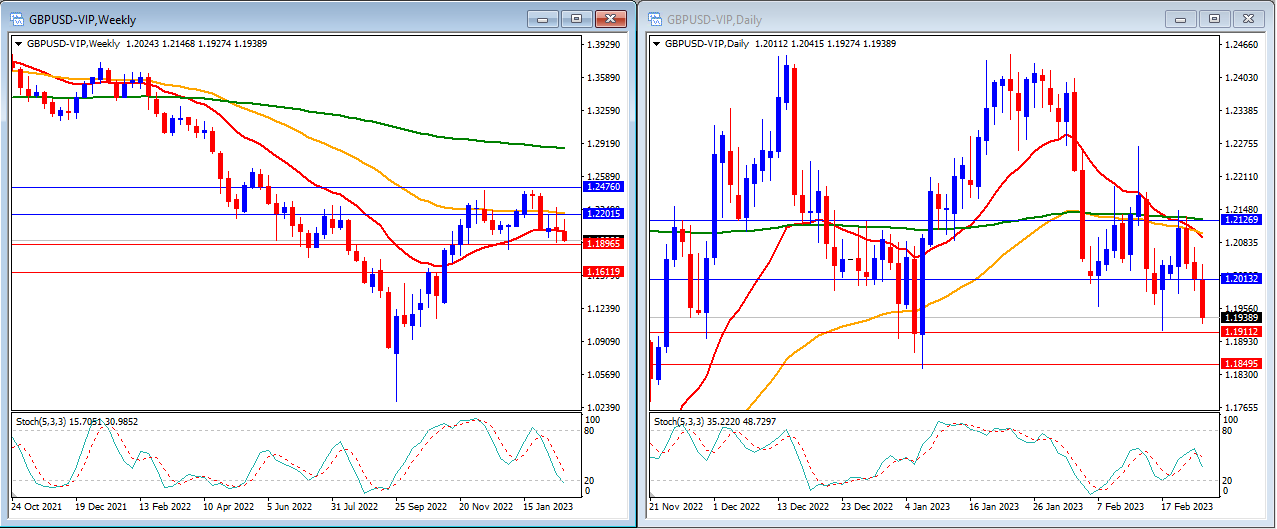
Last week, GBPUSD moved slightly lower, trying to break the 1.19 level. GBPUSD closed the week just slightly lower at 1.1938.
On the Weekly timeframe, we can see that the Stochastic Indicator is moving lower, targeting the oversold level. The price is now moving below the 20, 50 and 200-period moving averages.
Our Weekly resistance levels are at 1.2201 and 1.2476, with the support levels at 1.1896 and 1.1611.
On the Daily timeframe can see that our Stochastic Indicator is moving lower in the middle. The price is moving below the 20, 50 and 200-period moving averages.
Our Daily resistance levels are now at 1.2013 and 1.2126, while the support levels are at 1.1911 and 1.1849.
Conclusion: This week, the Bank of England governor Andrew Bailey is scheduled to give a speech which could impact the market. GBPUSD might move lower to reach below the 1.19 level.
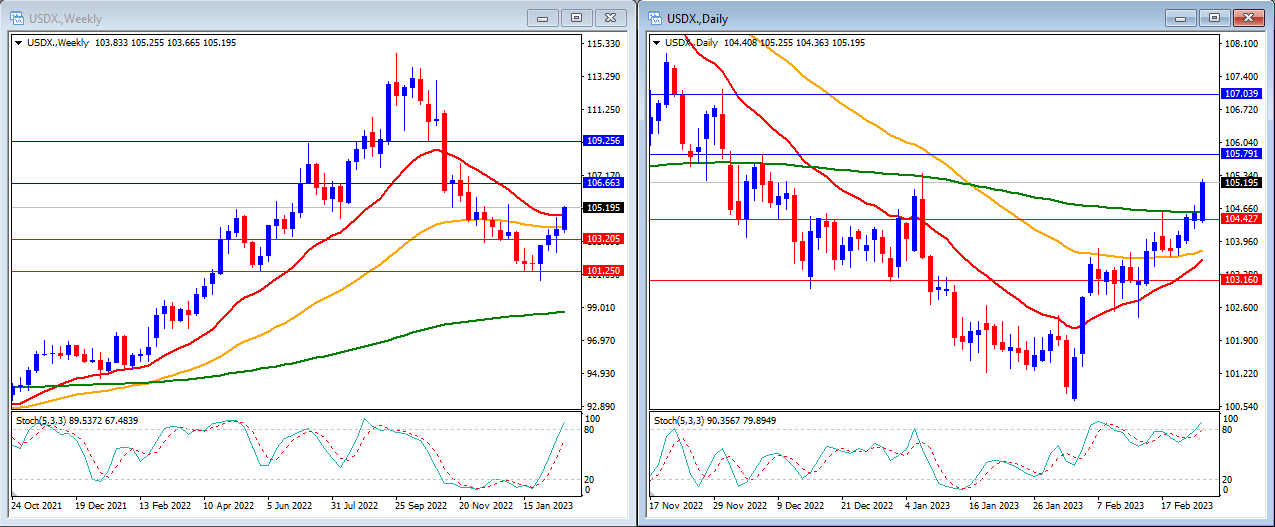
Last week, USD Index moved slightly higher after some strong US data releases and was supported by the Fed likely to raise its interest rate more. USD Index closes the week at 105.19.
On the Weekly timeframe, the Stochastic Indicator is moving strongly higher and targeting the overbought level. The price is moving above the 20, 50 and 200-period moving averages.
Our Weekly resistance levels are at 106.67 and 109.25, with the support levels at 103.20 and 101.25.
The Stochastic Indicator tries to enter the overbought level on the Daily timeframe. Price is now moving above the 20, 50 and 200-period moving averages.
Our Daily resistance levels are 105.79 and 107.03, with the support levels at 104.42 and 103.16.
Conclusion: The pace of the USD Index is expected to slow this week, with fewer high-impact events on the horizon. However, the ISM Manufacturing and Services PMI releases could support a stronger USD. As a result, the USDX may climb towards our resistance levels at 105.79 and 106.67.
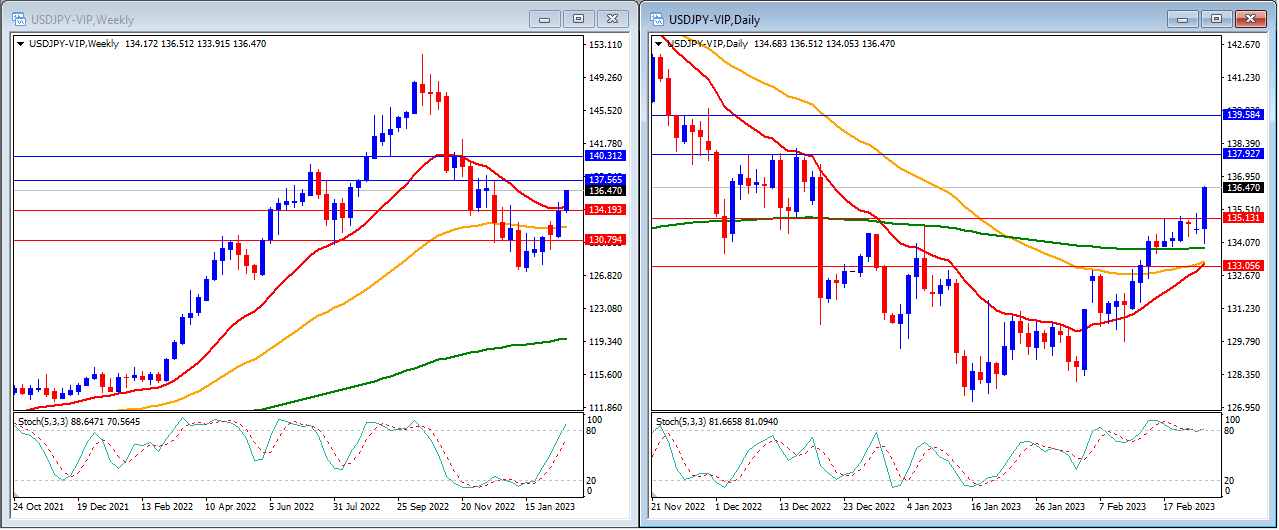
The USDJPY pair saw an upward movement last week, propelled by robust US economic data. By the end of the week, USDJPY had reached a closing value of 136.47.
On the Weekly timeframe, we can see that the Stochastic Indicator is moving higher, targeting the overbought level. The price is now moving above the 20, 50 and 200-period moving averages.
Our Weekly resistance levels are at 137.56 and 140.31, with the support levels at 134.19 and 130.79.
The Stochastic Indicator is moving just around the overbought level on the Daily timeframe. The price is moving above the 20, 50 and 200-period moving averages.
Our Daily resistance levels are 137.92 and 139.58, while the support levels are 135.13 and 133.05.
Conclusion: This week, the market’s attention is focused on the speech by the designated Bank of Japan governor, Kazuo Ueda. As a result, we anticipate a potential downturn for USDJPY, with a possible decline towards our support level of 135.13.
Make informed decisions with the most up-to-date and reliable financial data, exclusively provided by vtmarkets.com.