Spreads
Spreads
Spreads
Spreads
Spreads
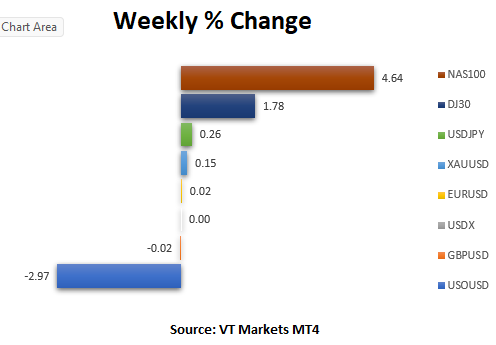
Last week, some markets were affected by the better-than-expected data in the US, which created some jumps in major currencies. But the market went slower at the end of the week to prepare for a packed week this week.
(All data is taken from the MT4 VT Markets)

(Picture taken from forexfactory.com)
We will have a packed week with high-impact key global market events this week. The US Fed, Bank of England, and the European Central Bank will announce their interest rate decision with some monetary policy reports. We will also have US Non-Farm Employment data for this week, which may make the market volatile.
31 January 2023 | Canada Gross Domestic Product m/m
The Canadian economy grew by 0.1% in October 2022 over the previous month, instead of the stagnation indicated in the preliminary estimate. This represents a slowdown from September’s 0.2% advance.
For December, analysts forecast the Canadian economy to remain stagnant at 0% growth from November 2022.
1 February 2023 | US ADP Non-Farm Employment Change
Private businesses in the US created 235,000 jobs in December 2022, higher than 182,000 in November.
For January, analysts expect lower figures, with only another 131,000 additional jobs.
1 February 2023 | US ISM Manufacturing PMI
In December 2022, the US ISM Manufacturing PMI fell to 48.4, its second month of contraction as Americans shifted spending away from goods to services.
Analysts expect January results to be 48.
1 February 2023 | FOMC Meeting and Rate Decision
The US Federal Reserve raised the fed funds rate by 50bps to 4.25%-4.5% during its last monetary policy meeting of 2022.
Analysts expect that the Fed will raise another 50bps this month.
2 February 2023 | BOE Monetary Policy Report
During its December meeting, the Bank of England voted by a majority of 6-3 to raise interest rates by 50bps to 3.5%, as policymakers try to contain inflation amid fears of a looming recession.
For this meeting, analysts expect that BoE would raise another 50bps.
2 February 2023 | ECB Monetary Policy Statement
The European Central Bank is set to raise interest rates by 50bps in February and March and will continue to do so in the months to come.
For this month, analysts expect that ECB will increase the rate by another 50bps.
3 February 2023 | US Non-Farm Employment Change
The US economy added 223,000 jobs in December 2022, the least since December 2020. Meanwhile, the unemployment rate dropped to 3.5%.
For January, analysts expect the US to add around 175,000 jobs, and the unemployment rate to be higher at 3.6%.
3 February 2023 | US ISM Services PMI
The US ISM Services PMI decreased to 49.6 in December 2022 from 56.5 in November.
Analysts predict that the reading will be kept at around 49-50 this month.
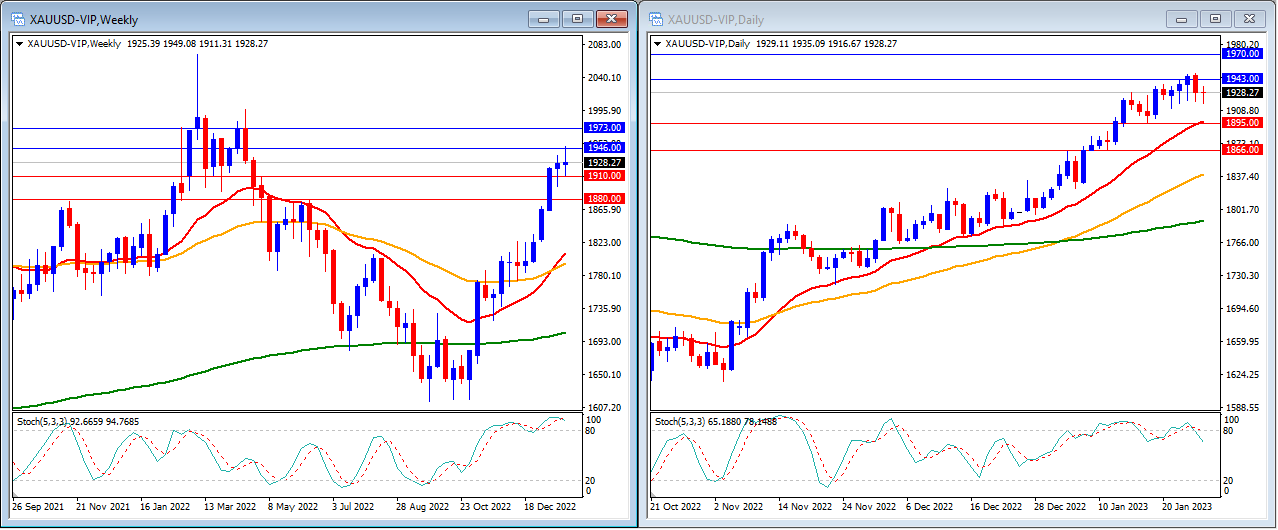
Last week, gold started the week lower a little bit and eventually reached our resistance levels at $1,943 and $1,946, as expected. Gold closes the week back lower at $1,928 below our resistance level.
On the weekly timeframe, we can see that the Stochastic Indicator is still strongly moving inside the overbought level with NO potential of crossing lower. Gold price is moving above the 20, 50 and 200-period moving averages.
Our Weekly resistance levels are at $1,946 and $1,973, with the support levels at $1,910 and $1,880.
Meanwhile, on the daily timeframe, the Stochastic Indicator is moving just outside the overbought level. Price is moving above the 20, 50 and 200-period moving averages.
Our Daily resistance levels are at $1,943 and $1,970, with the support levels at $1,895 and $1,866.
Conclusion: This week, we will have some packed global data that could affect gold volatility. Gold may start the week lower to reach our support level at 1910 before eventually going higher if the Fed show some dovish statement. Gold might move to reach our highest resistance levels at $1,970 and $1,973.
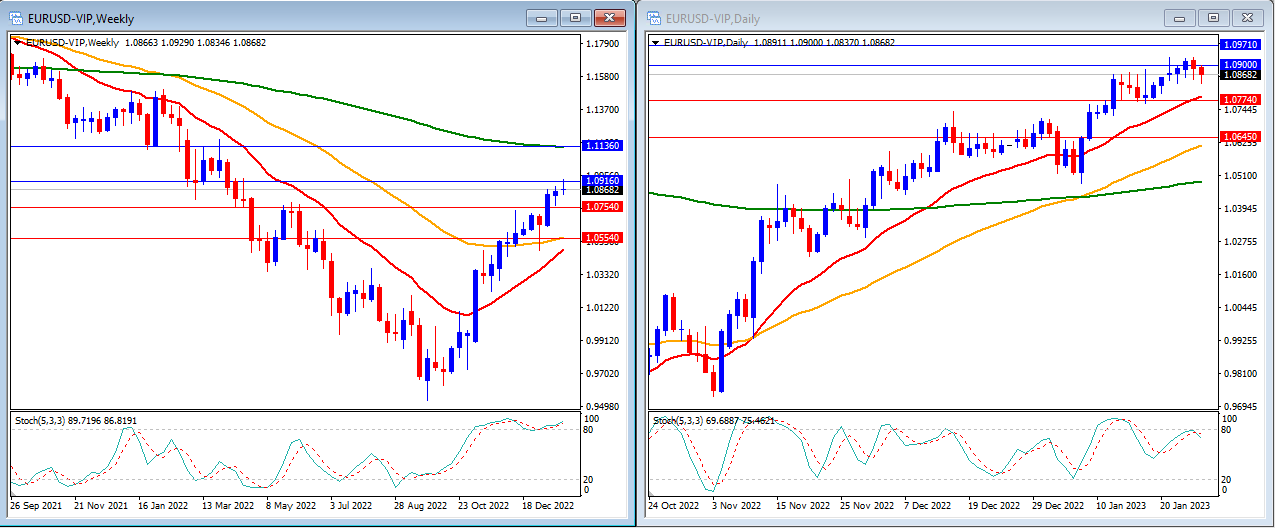
Last week, EURUSD was NOT able to reach our support and move higher to reach our weekly resistance at 1.0916 before closing the week lower at 1.0868.
In our weekly timeframe, the Stochastic Indicator is still moving inside the overbought level. The price continues to trade below the 200-period moving average and above the 20 and 50-period moving averages.
Our Weekly resistance levels are at 1.0916 and 1.1136, with the support levels at 1.0754 and 1.05544.
On our daily timeframe, we can see that our stochastic indicator is moving near the overbought level but sloping down. Price is moving above the 20, 50 and 200-period moving averages.
Our Daily resistance levels are at 1.0900 and 1.0971, while the support levels are at 1.0774 and 1.0645.
Conclusion: This week, the ECB, BoE and the US Fed will release their rate decisions and monetary policy statements, which will be the market movers, along with the US Non-Farm data. EURUSD may reach our support level at 1.0774.
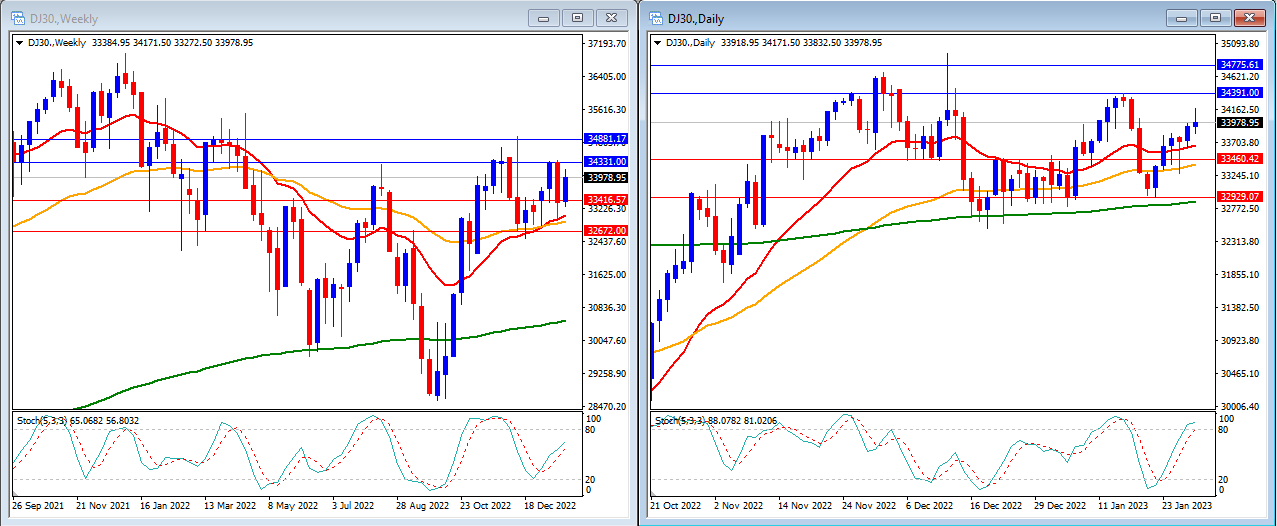
Last week, DJ30 was rising as the market entered the earning season, showing some good results from some companies. DJ30 ended the week higher at 33978.
On the Weekly timeframe, we can see that the Stochastic Indicator is moving higher in the middle. Price is moving above the 20, 50 and 200-period moving averages.
Our Weekly resistance levels are at 34331 and 34881, with the support levels at 33416 and 32672.
On our daily timeframe, we can see that our Stochastic Indicator is strongly moving higher, entering the overbought level. Price is moving above the 20, 50 and 200-period moving averages.
Our Daily resistance levels are now at 34391 and 34775, while the support levels are at 33460 and 32929.
Conclusion: DJ30 might continue to move higher this week with the possibility that the Fed will slow their pace in the interest rates, supported by better forecasted US Jobs data. We expect that DJ30 might reach our resistance levels at 34881 and 34775.
USOUSD
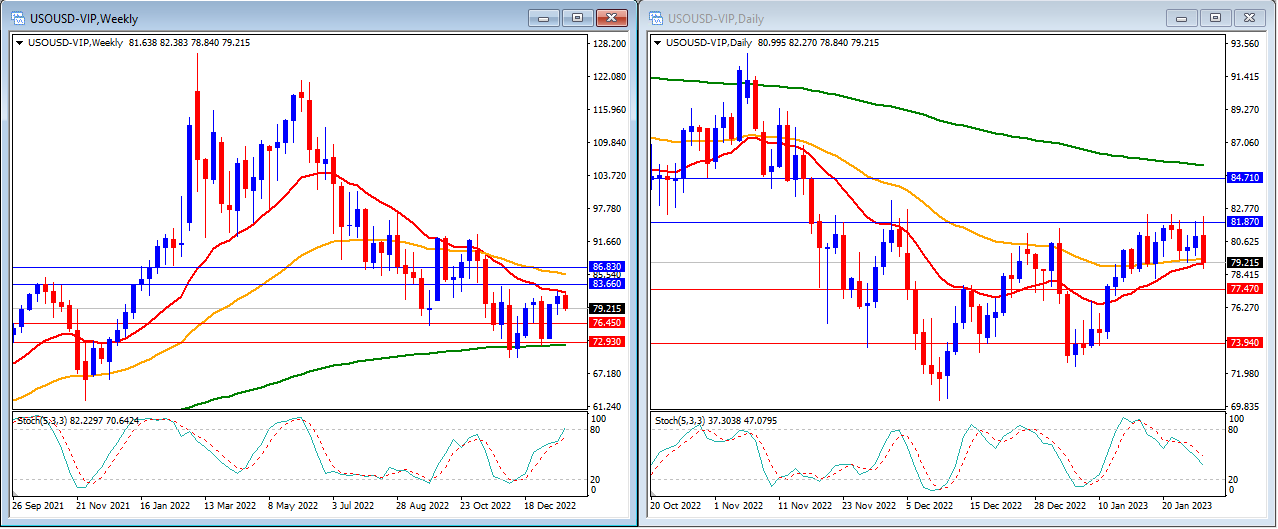
Last week, USOUSD was able to rise higher but unable to break our resistance level and closed the week lower at 79.21.
On the Weekly timeframe, we can see that the Stochastic Indicator is moving higher and targeting the overbought level. The price is moving below the 20 and 50-period moving averages and above the 200-period moving averages.
Our Weekly resistance levels are at 83.66 and 86.83, with the support levels at 76.45 and 72.93.
On our daily timeframe, we can see that our Stochastic Indicator is moving lower in the middle. Price moves just around the 20, and 50-period moving averages and below the 200-period moving averages.
Our Daily resistance levels are 81.87 and 84.71, while the support levels are at 77.47 and 73.94.
Conclusion: China re-opening will help oil demand, but a better supply from Russia will keep oil prices in some consolidating movement. For this week, we expect USOUSD to continue to move between our support and resistance levels, with a higher chance of lower movement towards our support level at 77.47.

Last week, NAS100 moved higher, affected by a strong result from some tech companies, and broke our resistance levels as expected. NAS100 closes the week at 12166.
On the Weekly timeframe, we can see that the Stochastic Indicator is moving strongly higher in the middle. The price is moving below the 50-period moving average and above the 20 and 200-period moving averages.
Our Weekly resistance levels are at 12413 and 12960, with the support levels at 11994 and 11556.
On our daily timeframe, we can see that our Stochastic Indicator is moving inside the overbought level but with NO condition of moving lower. The price is able to break higher to move above the 200-period moving average while still above the 20 and 50-period moving averages.
Our Daily resistance levels are now at 12339 and 12581, while the support levels are at 11915 and 11768.
Conclusion: NAS100 might move higher again this week, supported by the Fed and US jobs data, which all favour US stock markets. We expect NAS100 to try to reach our next resistance levels at 12339 and 12413.

Last week, GBPUSD moved lower to reach our daily support level as expected and higher to close the week between our support and resistance levels. GBPUSD closes the week higher at 1.2397.
On the Weekly timeframe, we can see that the Stochastic Indicator is moving higher and targeting the overbought level. The price moves above the 20-period and 50-period moving averages but still below the 200-period moving average.
Our Weekly resistance levels are now at 1.2499 and 1.2644, with the support levels at 1.2214 and 1.2017.
On the daily timeframe, we can see that our stochastic indicator is moving just near the overbought level limit. Price is moving above the 20, 50 and 200-period moving averages.
Our Daily resistance levels are now at 1.2434 and 1.2575, while the support levels are at 1.2312 and 1.2174.
Conclusion: This week, we will have the Bank of England rate decision and monetary policy report, together with the Fed and US Jobs data release. GBPUSD may move higher, break our resistance level at 1.2434 and try to reach the 1.25 level.
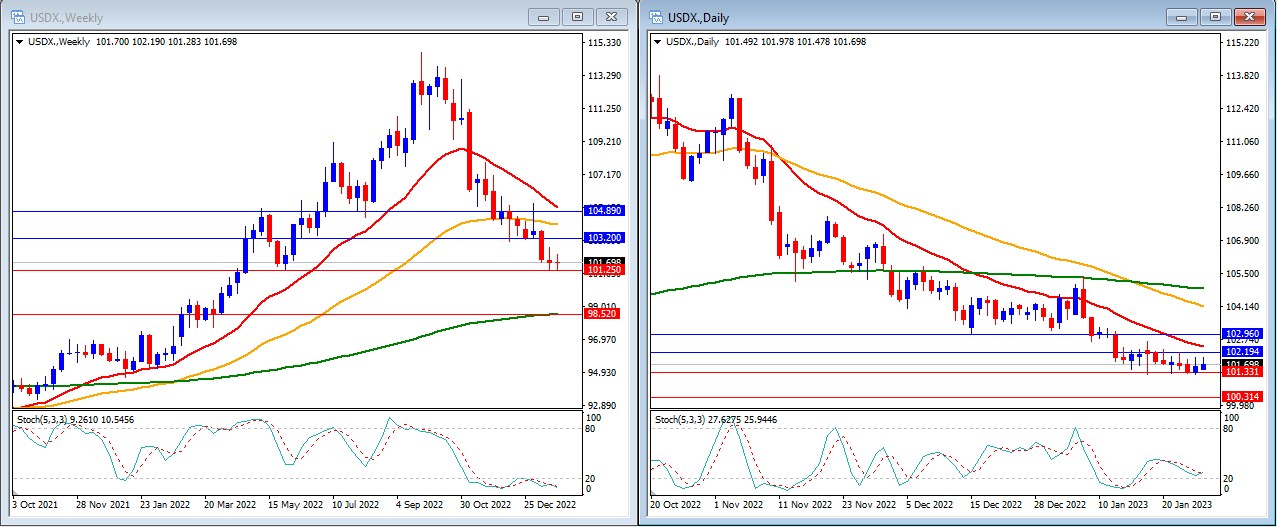
Last week, USD Index moved flat, unchanged from the open weekly price. USD Index closed the week at 101.69.
On the Weekly Timeframe, we can see that the Stochastic Indicator is moving inside the oversold level. Price is moving below the 20 and 50-period moving averages but still above the 200-period moving averages.
Our Weekly resistance levels are 103.20 and 104.89, with the support levels at 101.25 and 98.52.
Meanwhile, on the daily timeframe, the Stochastic Indicator is moving just above the oversold level. Price is moving below the 20, 50 and 200-period moving averages.
Our Daily resistance levels are 102.19 and 102.96, with the support levels at 101.33 and 100.31.
Conclusion: This week, we will have the Fed funds rate decision and US Non-Farm data, which definitely will move the USD Index. We expect the USD Index to go lower if the Fed shows its dovish decision to slow the rate hike pace. USD Index might reach our support levels of 101.25 and 101.33.
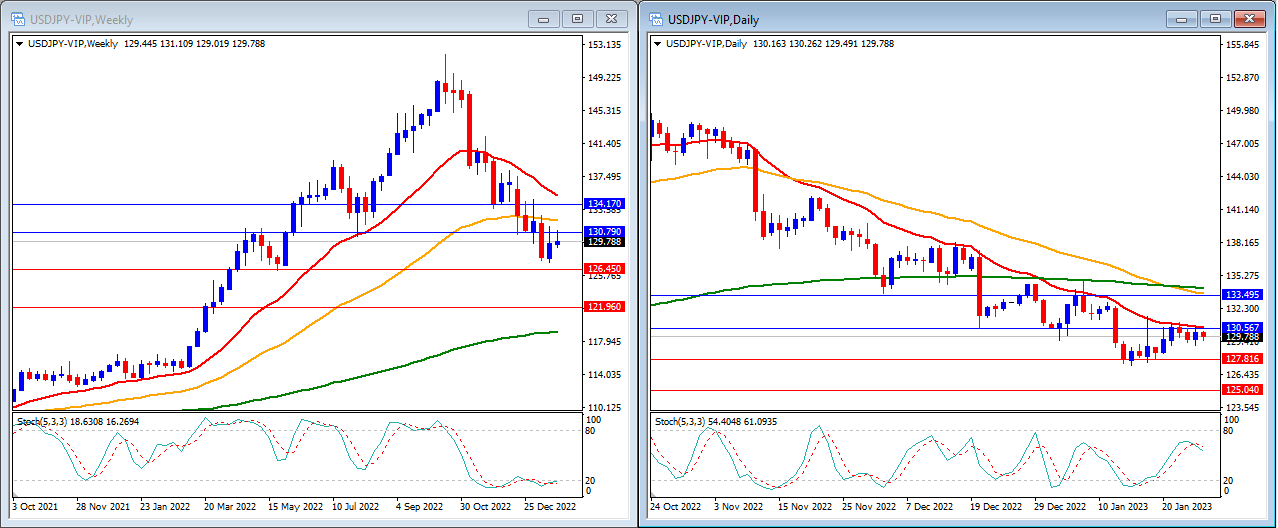
Last week, USDJPY was slightly higher and reached our resistance level as expected. USDJPY closed the week at 129.78.
On the Weekly timeframe, we can see that the Stochastic Indicator is moving inside the oversold level and preparing to exit. The price moves below the 20 and 50-period moving averages but remains above the 200-period moving average.
Our Weekly resistance levels are at 130.79 and 134.17, with the support levels at 126.45 and 121.96.
On the daily timeframe, the Stochastic Indicator is moving in the middle with NO clear direction. Price is moving below the 20, 50 and 200-period moving averages.
Our Daily resistance levels are 130.56 and 133.49, while the support levels are 127.81 and 125.04.
Conclusion: This week, USDJPY will be affected by the USD as the Fed will decide its rate decision. We will also have US Non-Farm data. We expect USDJPY to move lower if the Fed shows a dovish statement and reaches our support level at 127.81.