Spreads
Spreads
Spreads
Spreads
Spreads

Last week, the market was affected by US CPI data, which came as forecasted and showed that inflation in the US is slower, creating an expectation that the FED will start to slow down from their aggressive action.
(All data taken from MT4 VT Markets)
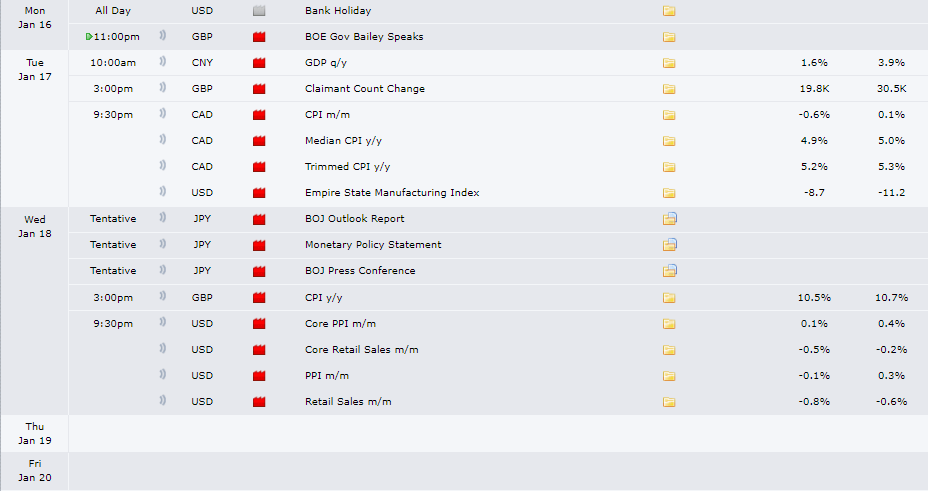
(Picture taken from forexfactory.com)
What to focus on this week?
This week, the market will focus on the Bank of Japan’s monetary policy statement and the release of US PPI and Retail Sales data after US CPI data was released as forecasted last week. This is one of the indications of what the Fed will do at the upcoming FOMC meeting.
Here are this week’s key important events:
17 January 2022 | UK Claimant Count Change
The UK recorded an increase of 30,500 people claiming unemployment benefits in November of 2022, the biggest increase since February last year.
Analysts expect December’s data to be lower and higher by 16,000.
17 January 2022 | Canada Consumer Price Index
Canadian consumer prices increased by 0.1% from the previous month in November of 2022, slowing from the 0.7% increase in October.
Analysts expect December’s CPI reading to be higher by 0.3%.
17 January 2022 | US NY Empire State Manufacturing Index
The New York Empire State Manufacturing Index fell 16 points from the previous month to -11.2 in December 2022, below market expectations of -1 and the steepest deterioration in New York State manufacturing since August.
Analysts expect January’s reading to be higher but still in negative territory at -4.5.
18 January 2022 | Bank of Japan Monetary Policy Statement
The BoJ shocked markets on 20 December with a surprise widening of the band around its 10-year yield target, allowing long-term rates to rise more while keeping its key interest rate steady at -0.1%.
Analysts expect that for this meeting, BoJ will keep their interest rate in the negative territory.
18 January 2022 | UK Consumer Price Index
The Consumer Price Index in the UK increased 0.40% in November of 2022 over the previous month, the smallest increase since January 2022.
Analysts expect December’s CPI to increase another 0.40% and could show an increase of 11.1% in the UK’s annual inflation reading.
18 January 2022 | US Retail Sales
Retail sales in the US declined 0.6% month-on-month in November of 2022, much worse than market forecasts of a 0.1% fall.
Analysts expect December’s retail sales reading to drop more by 0.5%.
18 January 2022 | US Producer Price Index
The US PPI for final demand increased 0.3% month-on-month in November of 2022, the same as an upwardly revised 0.3% increase in October.
Analysts expect December’s PPI reading to remain at 0% or lower by 0.1%.
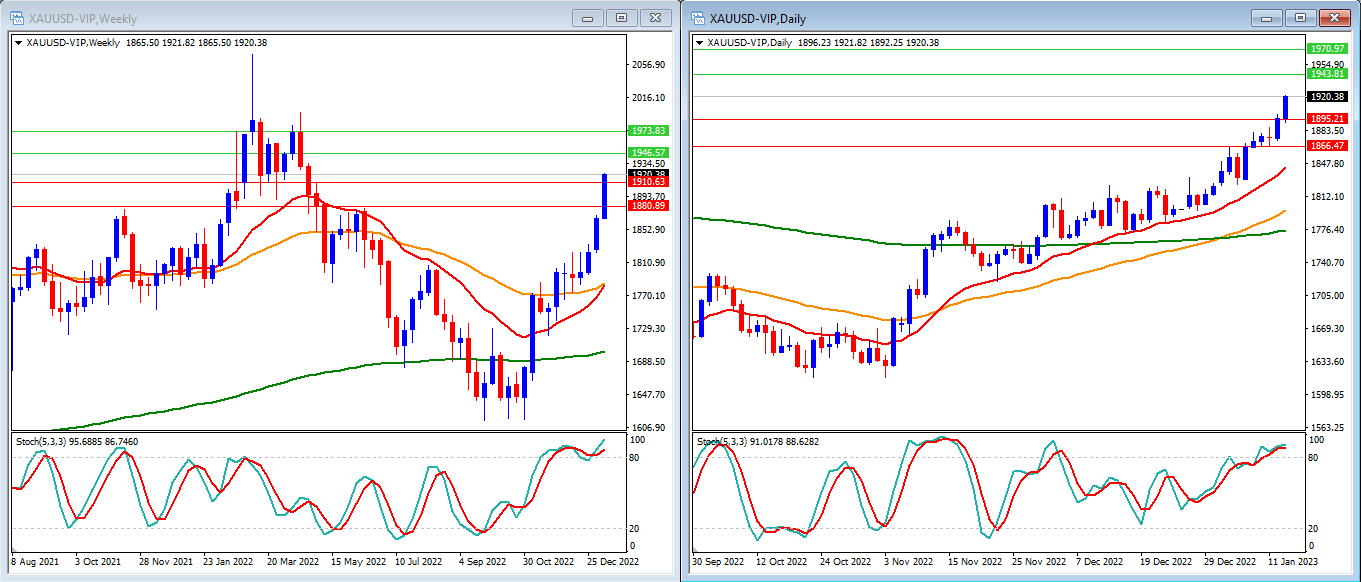
Last week, gold moved higher as expected, breaking the $1,900 barrier as US CPI data showed slower inflation in the US. Gold closed the week higher at $1,920.
On the weekly timeframe, we can see that the Stochastic Indicator is still strongly moving inside the overbought level with NO potential of crossing lower. The price of gold is moving above the 20, 50, and 200-period moving averages.
Our Weekly resistance levels are at $1,946 and $1,973, with the support levels at $1,910 and $1,880.
Meanwhile, on the daily timeframe, the Stochastic Indicator is moving inside the overbought level. Price is moving above the 20, 50 and 200-period moving averages.
Our Daily resistance levels are at $1,943 and $1,970, with the support levels at $1,895 and $1,866.
Conclusion: This week, US PPI and Retail Sales data will be released, which may affect the gold movement. We expect that gold may continue to move higher and try to reach our next resistance level at $1,943 and $1,946.
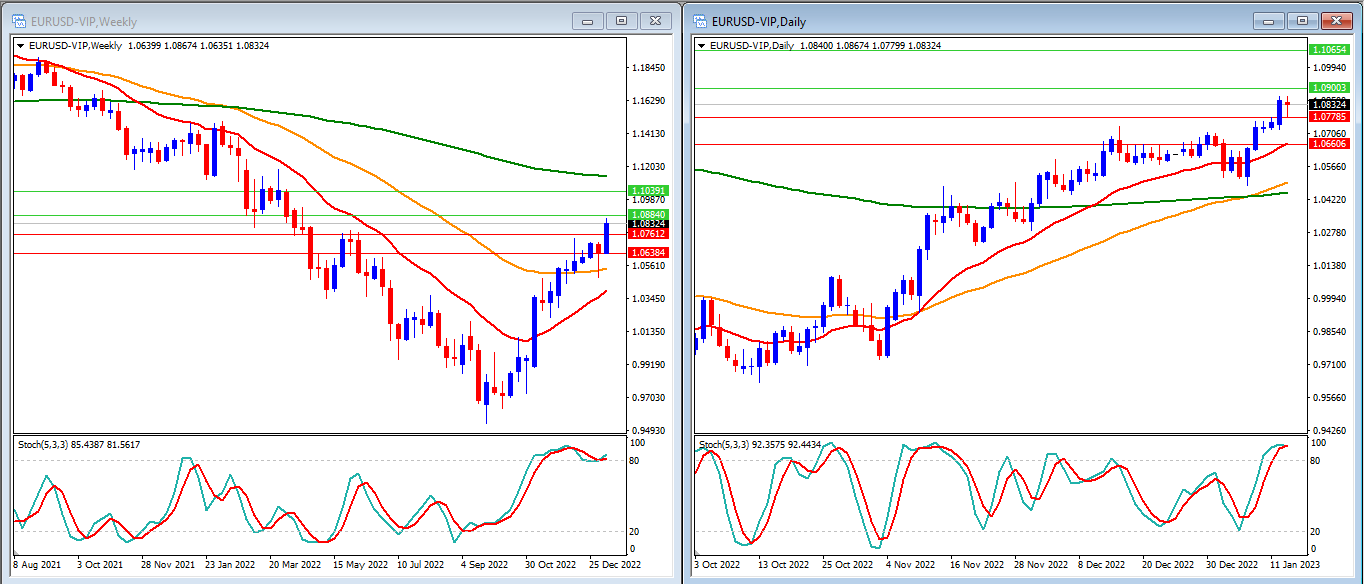
Last week, EURUSD moved higher and reached above our resistance levels at 1.0772 and 1.0780 as expected. EURUSD ends the week at 1.0832.
On our weekly timeframe, the Stochastic Indicator is still moving inside the overbought level. The price continues to trade below the 200-period moving average and above the 20 and 50-period moving averages.
Our Weekly resistance levels are at 1.0884 and 1.1039, with the support levels at 1.0761 and 1.0638.
On our daily timeframe, we can see that our Stochastic Indicator is just entering the overbought level. Price is moving above the 20, 50, and 200-period moving averages.
Our Daily resistance levels are at 1.0900 and 1.1065, while the support levels are at 1.0778 and 1.0660.
Conclusion: This week, we will have US PPI and Retail sales as the market movers. We expect EURUSD to move slightly higher to reach our weekly resistance level at 1.0884 before going lower to reach our support level at 1.0778.

Last week, DJ30 end the week higher and was able to break our resistance levels at 33763 and 33990 as expected. DJ30 ends the week stronger at 34315.
On the Weekly timeframe, we can see that the Stochastic Indicator is moving higher above the oversold level. Price is moving above the 20, 50 and 200-period moving averages.
Our Weekly resistance levels are at 34785 and 35604, with the support levels at 33968 and 33490.
On our Daily timeframe, we can see that our Stochastic Indicator is moving higher, entering the overbought level. Price is moving above the 20, 50 and 200-period moving averages.
Our Daily resistance levels are now at 34612 and 34940, while the support levels are at 33800 and 33179.
Conclusion: DJ30 might move higher this week, especially when the US PPI and retail sales release in favour of week USD. We expect that DJ30 may try to reach our resistance levels at 34612 and 34785.

Last week, USOUSD rose as high as 80.08, which was affected by the US dollar and the rise in demand from top companies in China. USOUSD closed the week just above the 80.00 level at 80.03.
On the Weekly timeframe, we can see that the Stochastic Indicator is in the middle and shows a strong move higher. The price is moving below the 20 and 50-period moving averages and above the 200-period moving average.
Our Weekly resistance levels are at 83.66 and 86.83, with the support levels at 76.45 and 72.93.
On our Daily timeframe, we can see that our Stochastic Indicator is entering the overbought level. Price moves above the 20 and 50-period moving averages and below the 200-period moving average.
Our Daily resistance levels are at 81.87 and 84.71, while the support levels are at 77.47 and 73.94.
Conclusion: The rise in oil demand is helping USOUSD to move higher. For this week, we are still expecting that USOUSD can continue to move higher to try to reach our daily resistance level at 81.87 before showing more clear direction.
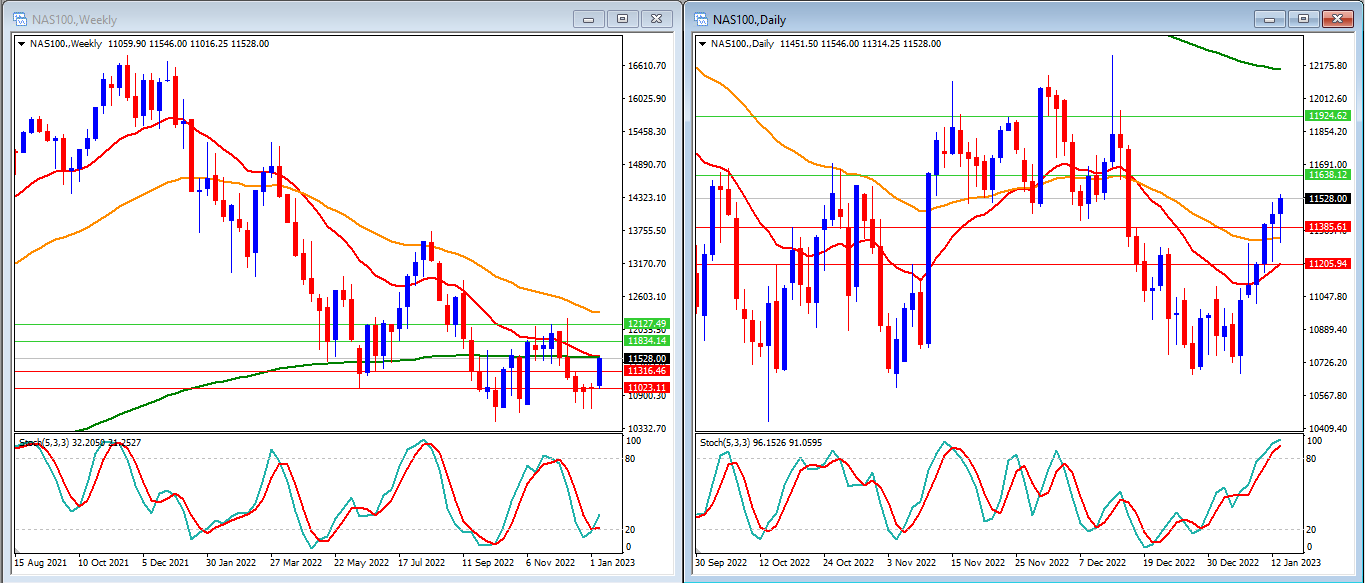
Last week, NAS100 moved higher and was able to reach above our resistance levels at 11256 and 11316 as expected. NAS100 closed the week at 11528.
On the Weekly timeframe, we can see that the Stochastic Indicator is crossing back higher above the oversold level. The price is moving below the 50-period moving average and just at the 20 and 200-period moving averages.
Our Weekly resistance levels are at 11834 and 12127, with the support levels at 11316 and 11023.
On our Daily timeframe, we can see that our Stochastic Indicator is entering the overbought level and is strongly higher. Price is now moving above the 20 and 50-period moving averages but still below the 200-period moving average.
Our Daily resistance levels are now at 11638 and 11924, while the support levels are at 11385 and 11205.
Conclusion: NAS100 may move higher this week, especially when the US PPI and retail sales release in favour of week USD. We expect NAS100 to try to reach our resistance levels at 11834 and 11924.

Last week, GBPUSD moved higher, which was affected by the strong UK GDP and lower US Inflation data, closing the week higher at 1.2232.
On the Weekly timeframe, we can see that the Stochastic Indicator is trying to cross back higher in the middle. The price still moves above the 20-period moving average, just at the 50-period moving average and below the 200-period moving average.
Our Weekly resistance levels are now at 1.2300 and 1.2644, with the support levels at 1.2028 and 1.1867.
On the daily timeframe, we can see that our Stochastic Indicator is moving higher, entering the overbought level. Price is moving above the 20, 50 and 200-period moving averages.
Our Daily resistance levels are now at 1.2295 and 1.2347, while the support levels are at 1.2128 and 1.2007.
Conclusion: This week, US PPI and Retail Sales data will be released, which may affect the GBPUSD. We expect GBPUSD to move higher to reach our resistance levels at 1.2295 and 1.2300.

Last week, USD Index dropped and reached the 101 region as expected. USD Index closed the week at 101.89, above our daily support level (101.71).
On the Weekly Time Frame, we can see that the Stochastic Indicator is moving inside the oversold level. Price is moving below the 20 and 50-period moving averages but still above the 200-period moving average.
Our Weekly resistance levels are at 103.20 and 104.89, with the support levels at 101.25 and 98.52.
Meanwhile, on the daily timeframe, the Stochastic Indicator also moves to the overbought level. Price is moving below the 20, 50 and 200-period moving averages.
Our Daily resistance levels are at 102.96 and 104.21, with the support levels at 101.71 and 101.02.
Conclusion: This week, we will have US PPI and Retail Sales data release, affecting the USD Index. We expect the USD Index to continue to move lower to reach our support level at 101.02 before eventually closing the week above the 101 level.
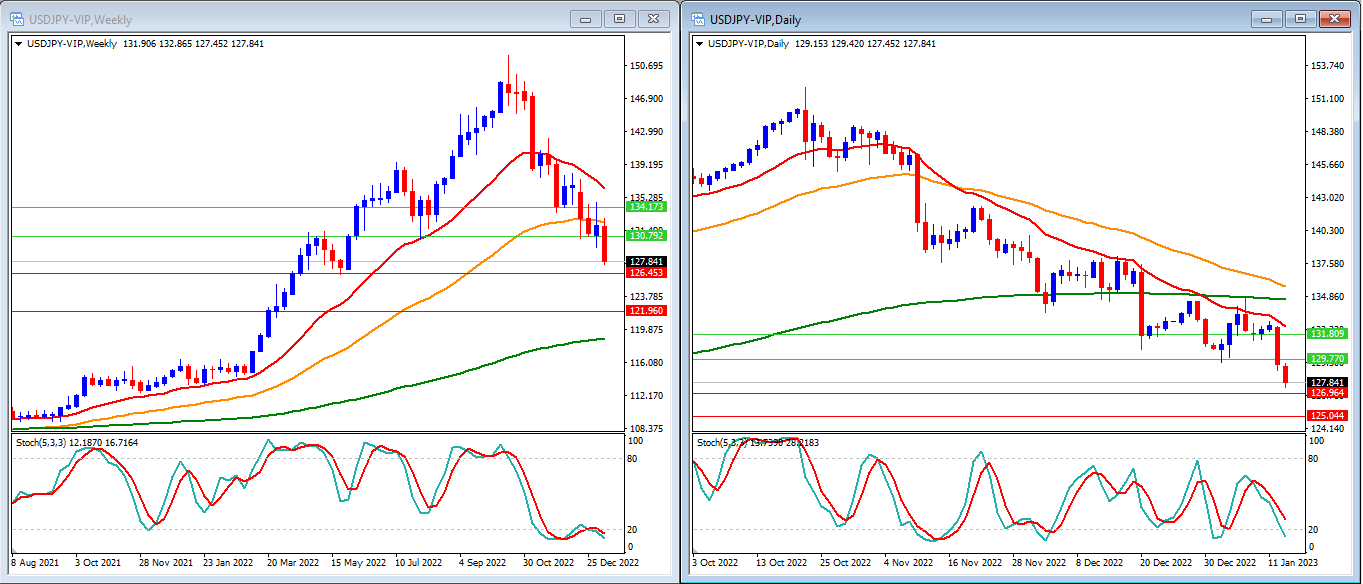
Last week, USDJPY was able to break our support level at 130.60 and 130.45 as expected affected by the strong indicators in Japan. USDJPY closed the week at 127.84.
On the Weekly timeframe, we can see that the Stochastic Indicator is moving inside the oversold level. The price moves below the 20 and 50-period moving averages but remains above the 200-period moving average.
Our Weekly resistance levels are at 130,79 and 134.17, with the support levels at 126.45 and 121.96.
On the daily timeframe, the stochastic indicator is moving lower, targeting the oversold level. Price is moving below the 20, 50 and 200-period moving averages.
Our Daily resistance levels are 129.77 and 131.80, while the support levels are 126.96 and 125.04.
Conclusion: This week, USDJPY might have strong volatility as the Bank of Japan announces its monetary policy. The BoJ will either keep its low-interest rate or not. US PPI and Retail Sales data will also be released. We expect USDJPY to move higher to reach our daily resistance level at 129.77 if the Bank of Japan’s decision is dovish and has stronger data in the US.