Spreads
Spreads
Spreads
Spreads
Spreads
EURUSD (4-Hour Chart)
The EUR/USD pair advanced higher on Tuesday, trading in a tight range and rebounded slightly towards the 1.0750 mark amid the fading market optimism that dominated the start of the week. The pair is now trading at 1.0737, posting a 0.09% gain on a daily basis. EUR/USD stays in the positive territory amid renewed US Dollar weakness, as the greenback came under selling pressure after FOMC Chairman Jerome Powell refrained from commenting on the policy outlook. However, comments by Fed policymakers emphasizing the central bank’s resolution to curb inflation slightly weighed on investors’ mood, as Fed’s Daly and Bostic added that rates would need to be above the 5% range and would need to be held higher for longer. In the Eurozone, the rising German 10-year Bond yields are acting as a tailwind for the EUR/USD pair. Meanwhile, European Central Bank officials continue to speak with a hawkish tone.
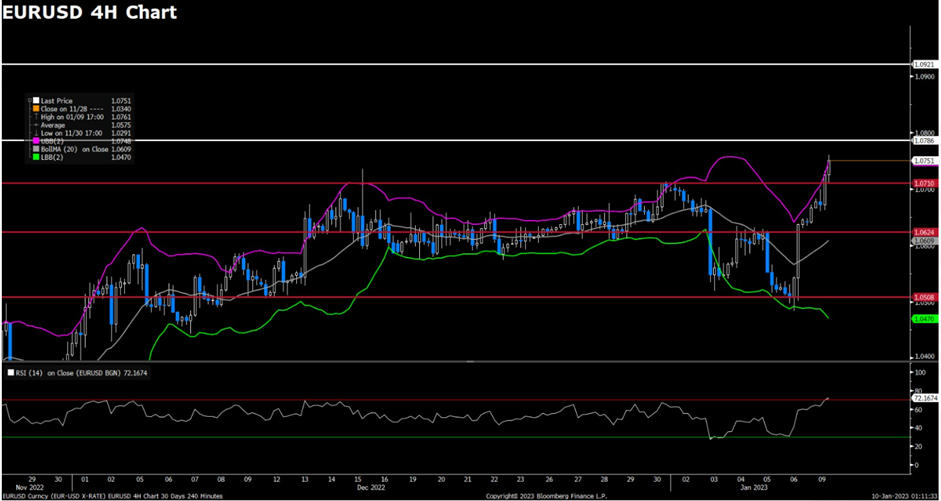
For the technical aspect, RSI indicator 63 figures as of writing, suggesting that the bull is more favoured as the RSI stays above the mid-line. As for the Bollinger Bands, the price is hovering between the upper band and the moving average, therefore the upside traction should persist. In conclusion, we think the market will be slightly bullish as the pair is heading to re-test the 1.0750 resistance level. Technical indicators also hold directionless within positive levels, reflecting limited selling interest.
Resistance: 1.0750, 1.0786
Support: 1.0710, 1.0624, 1.0548
GBPUSD (4-Hour Chart)
GBP/USD loses upward momentum and falls to around 1.2150. The US dollar index remains prudent in the cautious market mood and makes it difficult for the pair to gain traction. The US dollar index is currently trading at 103. On the other hand, US Treasury yields regain some upward traction and bounced off recent lows. As for Fed Chair Powell’s speech, there are no initial comments on current US economic or monetary policy from Powell in Sweden. Powell’s comments are on central bank independence and climate policy-making. The market now lacks catalysts. For more price action, eye on the US CPI report on Thursday.
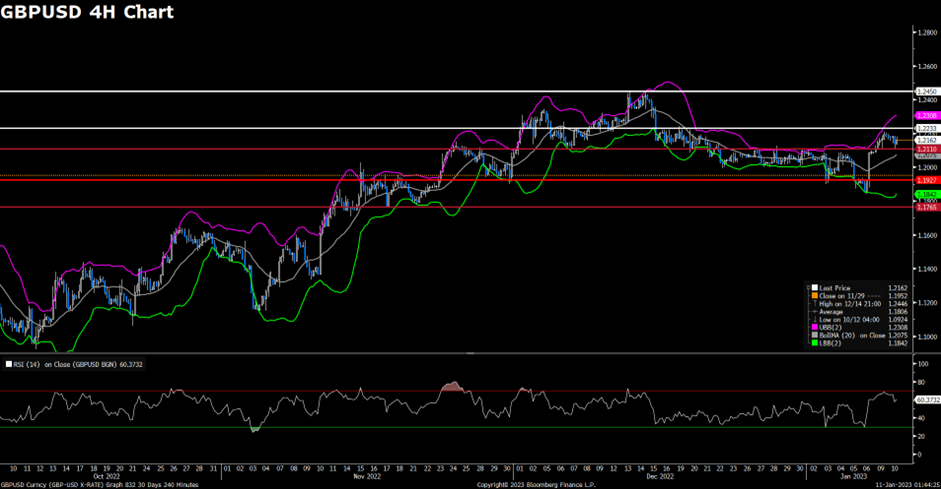
For the technical aspect, the RSI indicator is 60 figures as of writing, suggesting that the pair is in bullish mode as the indicator keeps in a bullish region. For the Bolling Bands, the price is hovering between the upward average and upper bound, signalling that the trend is still upward. For the price action, the pair is now trading between the first resistance and the first support transformed from resistance after the breakthrough. In conclusion, we think GBPUSD is in a bullish mode based on the technical analysis. For the uptrend scenario, if the price breaks the resistance at 1.2233, it may head to test the resistance at 1.2450. For the downtrend scenario, if the price close negative below support at 1.2110, it may head to test the support at 1.1927.
Resistance: 1.2233, 1.2450
Support: 1.2110, 1.1927, 1.1765
XAUUSD (4-Hour Chart)
Gold price loses upward momentum on Tuesday as the US dollar index remains prudent on the cautious market mood. At the time of writing, gold price hold around $1,872. On the other hand, US Treasury yields regain some upward traction and bounced off recent lows. The benchmark 10-year US Treasury bond yield is up nearly 2% on the day at around 3.6%, limiting the upside for gold prices. For more price action, eye on the US CPI report on Thursday, which may provide cues of future monetary policy.
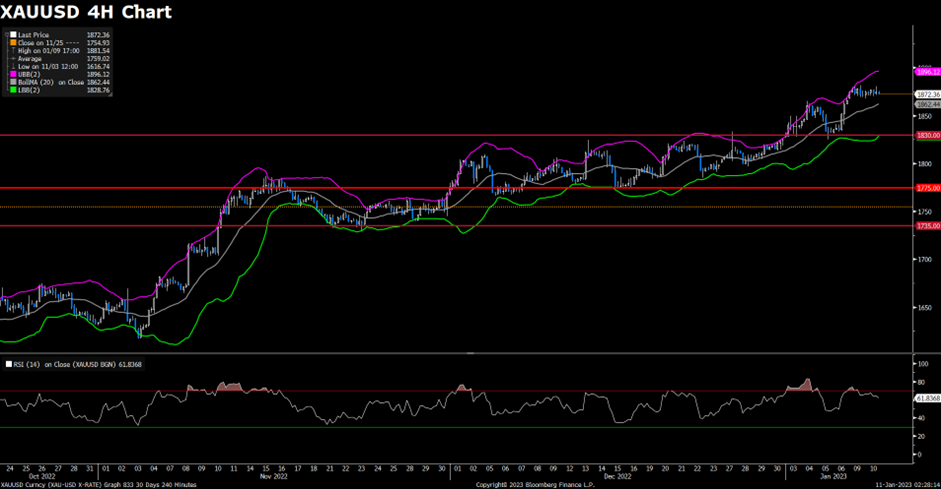
For the technical aspect, RSI indicator 62 figures as of writing, holding above the mid-line, suggesting that the pair is in bullish mode. For the Bolling Bands, the price is hovering between the upward average and upper bound. The upward trend should persist. For the price action, the price holds in a narrow range from Monday as the market now lacks catalysts. In conclusion, we think the gold price is still in a bullish mode based on the technical analysis. For the uptrend scenario, the price needs a decisive breakthrough to trigger the follow-through buy interest. For the downtrend scenario, traders should aware of the key level at $1,830. If the price drop below this level on the 4H chart, it may change the current trend.
Resistance: 1879, 1889
Support: 1830, 1775, 1735