Spreads
Spreads
Spreads
Spreads
Spreads

In the first week of 2023, there was some volatility movement. The market began the week favouring safe havens as the safer option. Still, in the second half of the week, it was impacted by US employment data that was overall stronger than anticipated.
(All data is taken from the MT4 VT Markets)

(Picture taken from forexfactory.com)
This week, the market will focus on the release of US CPI data, following US jobs data that exceeded expectations last week. US CPI will reveal the inflation situation to anticipate what the Fed will do at the upcoming FOMC meeting.
Here are this week’s key important events:
11 January 2022 | Australia Consumer Price Index
The monthly Consumer Price Index (CPI) indicator in Australia for October came below September’s record high of 7.3%.
Analysts expect November’s CPI reading to bounce back higher to 7.5%.
12 January 2022 | US Consumer Price Index m/m
The US Consumer Price Index increased by 0.1% from November 2022, slowing from the 0.4% increase in October. This result shows that the annual inflation rate in the US slowed for a fifth straight month to 7.1% in November of 2022, the lowest since December 2021.
For December 2022, analysts expect that US CPI might continue to slow down and will be released at -0.1%, which means that inflation is slowed more to 6.9%.
13 January 2022 | UK Gross Domestic Product m/m
The British economy expanded 0.5% in October from September of 2022, the most significant increase in nearly a year.
Analysts forecast UK GDP to be unchanged at 0.0% in November.
13 January 2022 | Prelim UoM Consumer Sentiment
The University of Michigan consumer sentiment for the US was revised to 59.7 in December 2022 from a preliminary of 59.1, higher than the previous month.
For this month, analysts expect UoM Consumer sentiment to be higher at 60.
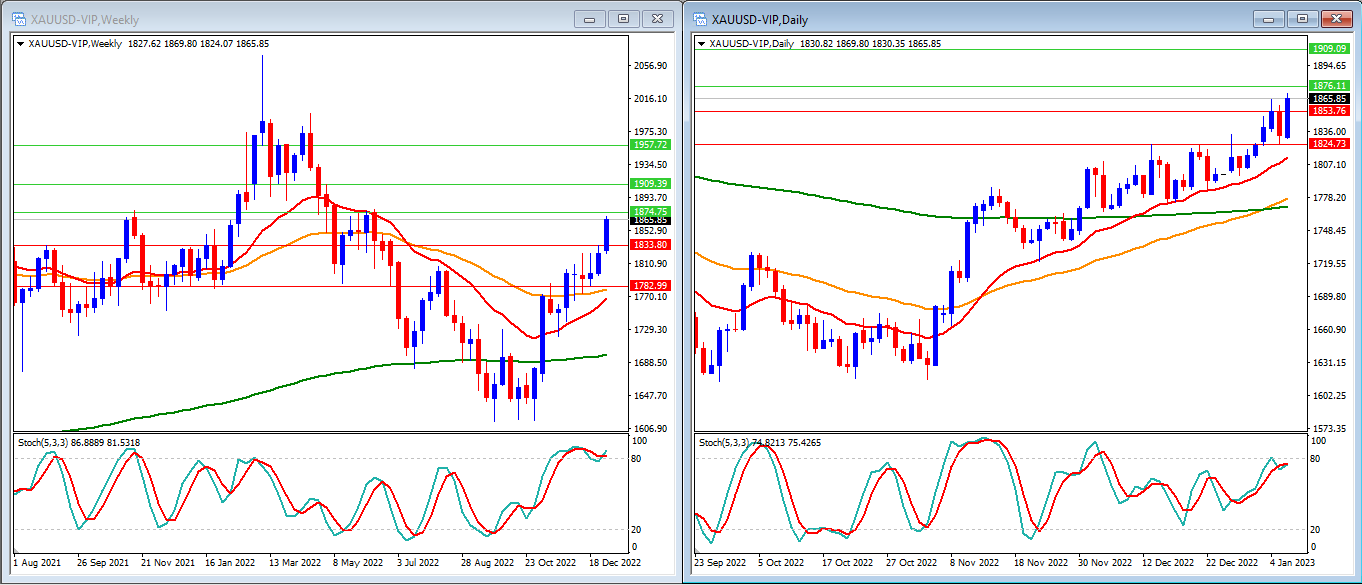
Last week, gold started the year 2023 with stronger movement as expected, able to break our resistance levels. Gold closes the week higher at $1,865, just below our resistance level.
On a weekly timeframe, we can see that the Stochastic Indicator is inside the overbought level with NO potential of crossing lower. Gold price is moving above the 20, 50 and 200-period moving averages.
Our Weekly resistance levels are at $1,874, $1,909 and $1,957, with the support levels at $1,833 and $1,782.
Meanwhile, the Stochastic Indicator is moving higher near the overbought level on the daily timeframe. Price is moving above the 20, 50 and 200-period moving averages.
Our Daily resistance levels are at $1,876 and $1,909, with the support levels at $1,853 and $1,824.
Conclusion: This week, the US CPI data will be released, affecting the gold movement. We expect that gold will move higher and try to break our next resistance level at $1,874 and move above $1,900.
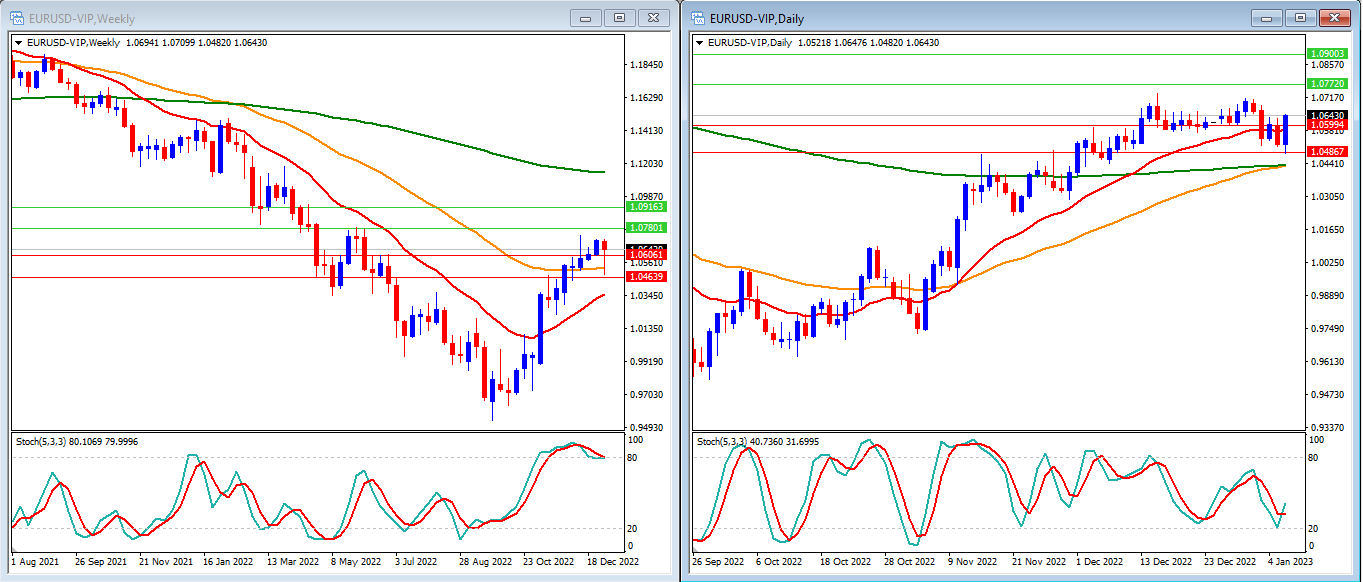
Last week, EURUSD moved lower early in the week and reached our support levels before going back higher to end the week at 1.0643 between our support and resistance levels.
On our weekly timeframe, the Stochastic Indicator is inside the overbought level. The price continues to trade below the 200-period moving average and above the 20 and 50-period moving averages.
Our Weekly resistance levels are at 1.0780 and 1.0916, with the support levels at 1.0606 and 1.0463.
On our daily timeframe, we can see that our stochastic indicator is crossing back higher near the oversold level. Price is moving above the 20, 50 and 200-period moving averages.
Our Daily resistance levels are at 1.0772 and 1.0903, while the support levels are at 1.0599 and 1.0486.
Conclusion: US CPI will be the market mover this week. EURUSD may move slightly lower to reach our support levels in the early week before moving higher and trying to reach our resistance levels at 1.0772 and 1.0780.

Last week, DJ30 ended the week higher and broke our previous daily resistance at 33472, as expected. DJ30 ended the week stronger at 33631.
On the Weekly timeframe, we can see that the Stochastic Indicator is moving just above the oversold level and starting to cross. Price is moving above the 20, 50, and 200-period moving averages.
Our Weekly resistance levels are at 33763 and 34785, with the support levels at 32672 and 32126.
On our daily timeframe, we can see that our stochastic indicator is crossing higher in the middle. Price is moving above the 20, 50 and 200-period moving averages.
Our Daily resistance levels are now at 33990 and 34612, while the support levels are at 32937 and 32500.
Conclusion: DJ30 might move higher if the US CPI data shows slower inflation. We expect that DJ30 may try to break our weekly resistance level at 33763 and reach our daily resistance level at 33990.
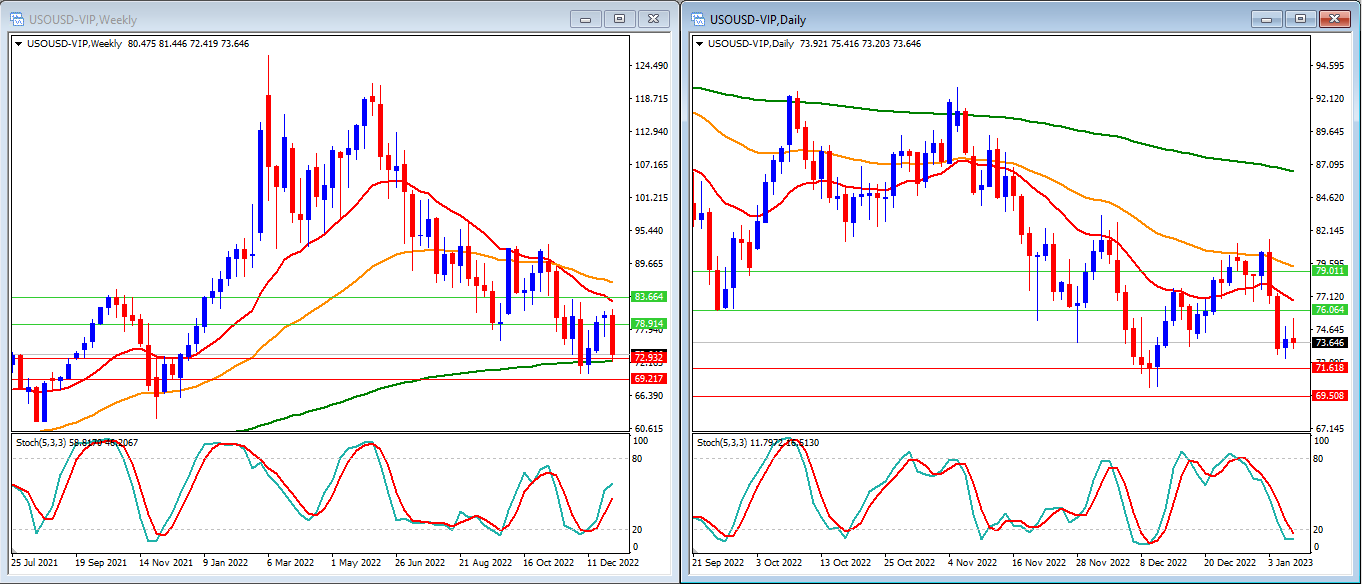
Last week, USOUSD fell as demand concerns continued to weigh on the market. USOUSD closes the week dropped and closes the week at 73.64.
On the Weekly timeframe, the Stochastic Indicator is in the middle and shows potential of crossing lower. The price is moving below the 20 and 50-period moving averages and just above the 200-period moving average.
Our Weekly resistance levels are now at 78.91 and 83.66, with the support levels at 72.93 and 69.21.
In our daily timeframe, we can see that our stochastic indicator is entering the oversold level. Price moves below the 20, 50 and 200-period moving average.
Our Daily resistance levels are at 80.88 and 81.80, while the support levels are at 77.42 and 76.37.
Conclusion: Oil demand still concerns the market. Some oil producers are starting to lower the price might create lower movement in oil. For this week, we expect that USOUSD will continue to move lower to try to break our weekly support level and 200-period moving average at 72.93 and 72.29 and might reach our daily support level at 71.61.
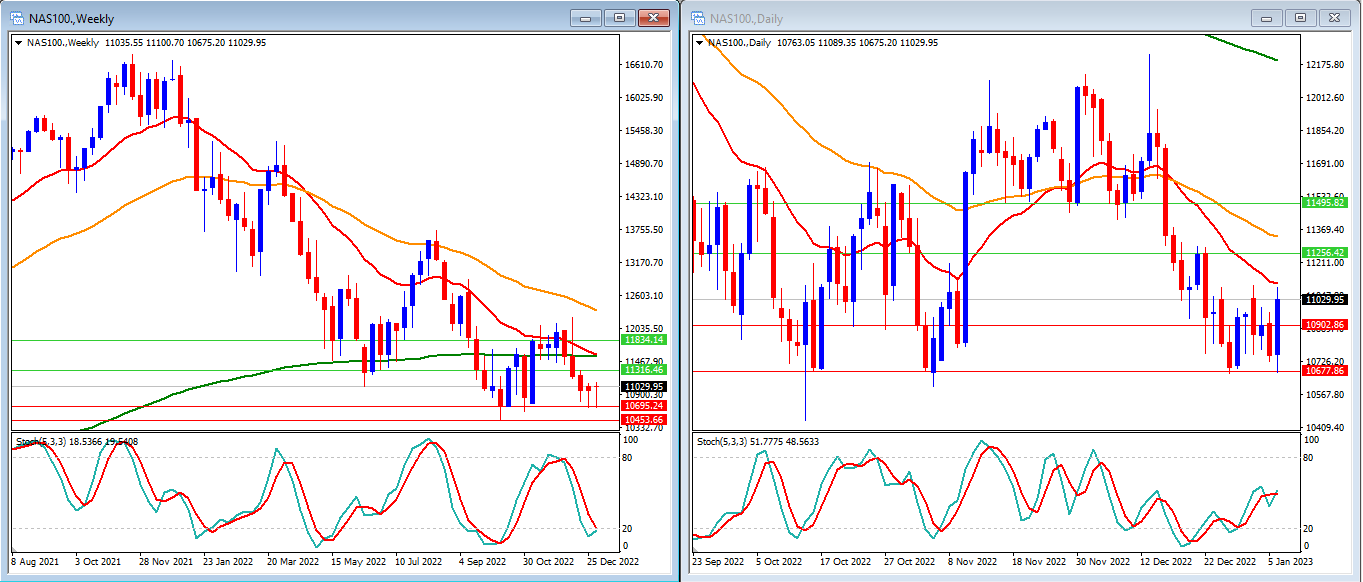
Last week, NAS100 moved lower to reach support levels but went back higher on Friday to keep moving between our support and resistance levels. NAS100 closed the week at 11029.
On the Weekly timeframe, we can see that the Stochastic Indicator is entering the oversold level. The price is moving below the 20, 50, and 200-period moving averages.
Our Weekly resistance levels are at 11316 and 11834, with the support levels at 10695 and 10453.
In our daily timeframe, we can see that our stochastic indicator is moving higher in the middle. Price is now moving below the 20, 50 and 200-period moving averages.
Our Daily resistance levels are now at 11256 and 11495, while the support levels are at 10902 and 10677.
Conclusion: NAS100 might move higher if the US CPI data shows slower inflation. We expect that NAS100 will move higher to reach our resistance levels at 11256 and 11316.
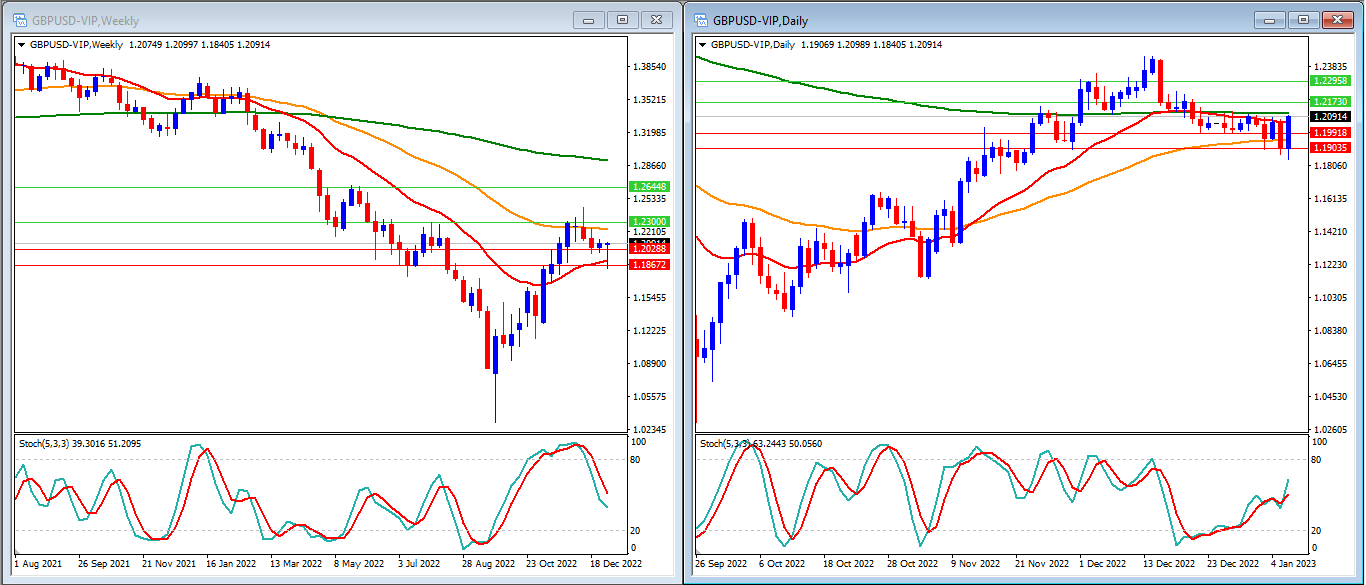
Last week, GBPUSD moved lower to reach our support levels as expected before ending the week higher above our support levels and closing the week higher at 1.2091.
On the Weekly timeframe, we can see that the Stochastic Indicator is moving lower in the middle. The price still moves above the 20-period moving average and below the 50 and 200-period moving averages.
Our Weekly resistance levels are now at 1.2300 and 1.2644, with the support levels at 1.2028 and 1.1867.
We can see that our stochastic indicator is moving higher in the middle on the daily timeframe. Price is moving above the 50-period moving average and around the 20 and 200-period moving averages.
Our Daily resistance levels are now at 1.2173 and 1.2295, while the support levels are at 1.1991 and 1.1903.
Conclusion: This week, we will have US CPI and UK GDP as market movers for the GBPUSD. GBPUSD may move lower to reach our support level as we have some strong resistance in our daily 200-period moving average. GBPUSD might break our support levels at 1.1991 and 1.2028 to move below 1.2 regions.
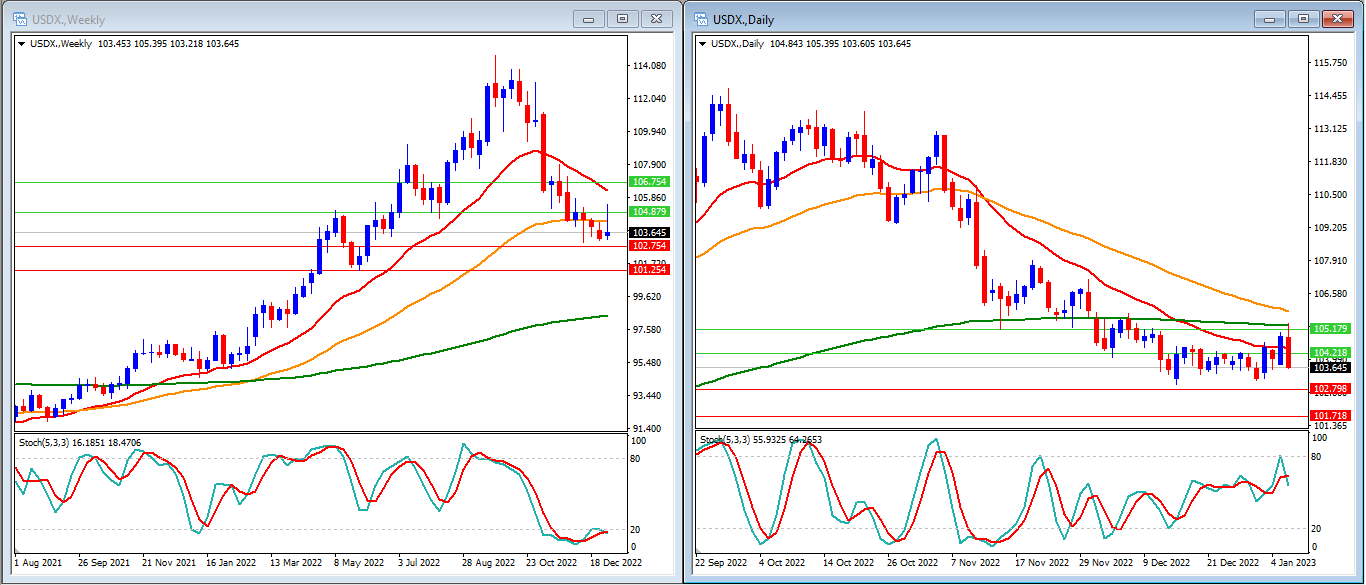
Last week, USD Index was moving higher at the start of the year before eventually returning lower. USD Index closed the week at 103.64.
On the Weekly Time Frame, we can see that the Stochastic Indicator is moving inside the oversold level. Price is moving below the 20 and 50-period moving averages but still above the 200-period moving average.
Our Weekly resistance levels are at 104.87 and 106.75, with the support levels at 102.75 and 101.25.
Meanwhile, on the daily timeframe, the Stochastic Indicator is moving in the middle with no clear direction. Price is moving below the 20, 50 and 200-period moving averages.
Our Daily resistance levels at 104.21 and 105.17, with the support levels at 102.79 and 101.71.
Conclusion: This week, we will have high movement in USD Index due to US CPI data that could affect the movement. We expect that US inflation will be slower, which could result in the USD Index continuing to move lower to break our support level at 102.79 and 102.75 to reach 101 regions.
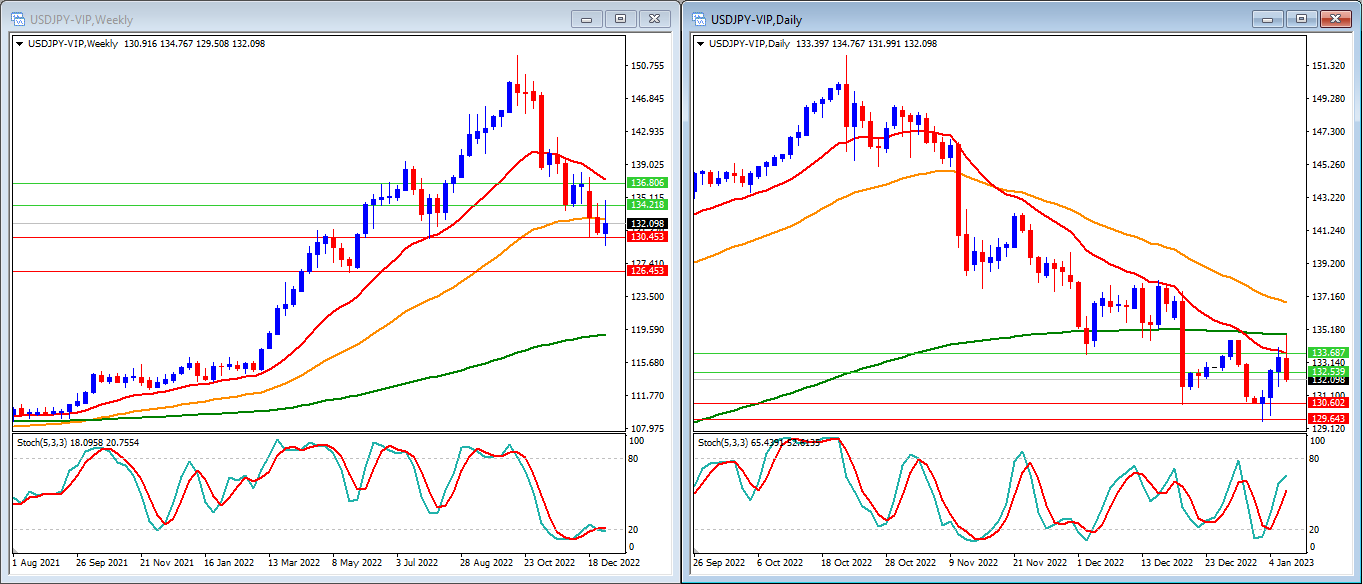
Last week, USDJPY reached our lowest daily support level at the start of the year, as expected, but then went back higher to reach our daily resistance levels. USDJPY closes the week in between our support and resistance levels at 132.09.
On the Weekly timeframe, we can see that the Stochastic Indicator is moving inside the oversold level with NO clear direction. The price moves below the 20 and 50-period moving averages but remains above the 200-period moving average.
Our Weekly resistance levels are at 134.21 and 136.80, with the support levels at 130.45 and 126.45.
On the daily timeframe, the stochastic indicator is consolidating higher in the middle. Price is moving below the 20, 50 and 200-period moving averages.
Our Daily resistance levels are 132.53 and 133.68, while the support levels are 130.60 and 129.64.
Conclusion: This week, USDJPY will be affected highly by the US$ as US CPI will show the latest condition in the US inflation. We expect USDJPY to move lower to break our support level at 130.60 and 130.45.