Spreads
Spreads
Spreads
Spreads
Spreads

The market only moved a little last week, as even US statistics such as PPI and retail sales failed to drive the market significantly. Only oil is moving due to concerns about weakening demand in China, the world’s largest oil importer, and the US Federal Reserve raising future interest rates, which pulled oil prices lower.
(All data taken from MT4 VT Markets)

(Picture taken from forexfactory.com)
The RBNZ interest rate hikes continued in October, with the bank raising its official cash rate by 50bps. This is the fifth half-point rate hike and follows a string of strong economic reports from New Zealand showing that domestic activity has been strengthening. Will they increase by another 75bps this time as forecasted?
Meanwhile, here’s what to expect for the week ahead:
RBNZ Rate Statement
The RBNZ raised its official cash rate to 3.5% in its October meeting, a level not seen since April 2015. Analysts forecast another 75bps hike for this round.
Domestic activities may have been stronger in Q3 2022, as supported by a better employment rate. However, its economy needs to be out of the inflation woods as spending on durable goods continues to fall.
French Flash Services PMI
France Services PMI was revised to 51.7 in October from a flash estimate of 51.3 but down from 52.9 in September.
The level of business confidence declined to its lowest level in almost two years. This reflects concerns over the possibility of persistently high inflation and a drop in investment appetite.
German Flash Manufacturing and Services PMI
Germany’s Manufacturing PMI declined to 45.1 in October 2022 from a preliminary of 45.7, pointing to a fourth month of falling factory activity and the biggest contraction since May 2020.
The Services PMI was revised higher to 46.5 in October from a preliminary estimate of 44.9, compared to the previous 28-month low of 45.0.
Analysts expect the Flash Manufacturing PMI to improve to 45.9 and Services PMI reading to 47.5.
UK Flash Manufacturing and Services PMI
UK Manufacturing PMI was revised higher to 46.2 in October from a preliminary estimate of 45.8. It still points to the steepest pace of contraction since May 2020.
UK Services PMI was revised higher to 48.8 in October from a preliminary of 47.5, the first overall decline in output since February 2021.
Analysts expect both Flash Manufacturing and Services PMI to be at 47.2.
US Flash Services PMI
US Services PMI was revised to 47.8 in October from a preliminary estimate of 46.6 compared with 49.3 in the previous month.
We can expect the US Flash Services reading to be better at 49.3.
FOMC Meeting Minutes
The Fed increased the target range for the federal funds rate by 75bps to 3.75%-4% in November, pushing borrowing costs to a new high since 2008.
The Fed aims to attain a stance of monetary policy to return inflation to 2%.

Last week we expected that gold might move to reach our resistance level at $1,806 but could not push through. Gold moved in a short range and closed the week at $1,750.
On the weekly timeframe, we can see that the Stochastic Indicator shows a strong higher movement. Gold price is moving above the 20 and 200-period moving averages but cannot break above the 50-period moving average.
Our Weekly resistance levels are at $1,830 and $1,878, with the support levels at $1,743 and $1,688.
On the daily timeframe, the Stochastic Indicator exits the overbought level with the potential of moving lower. Meanwhile, the price is still moving above the 20 and 50-period moving averages and breaking back below the 200-period moving average.
Our Daily resistance levels are at $1,806 and $1,873, with the support levels at $1,728 and $1,696.
Conclusion: With only PMI data for this week and FOMC Meeting minutes for release, we expect that gold might move lower for the week, trying to break our support levels and touch our weekly 20-period moving average at $1,716.
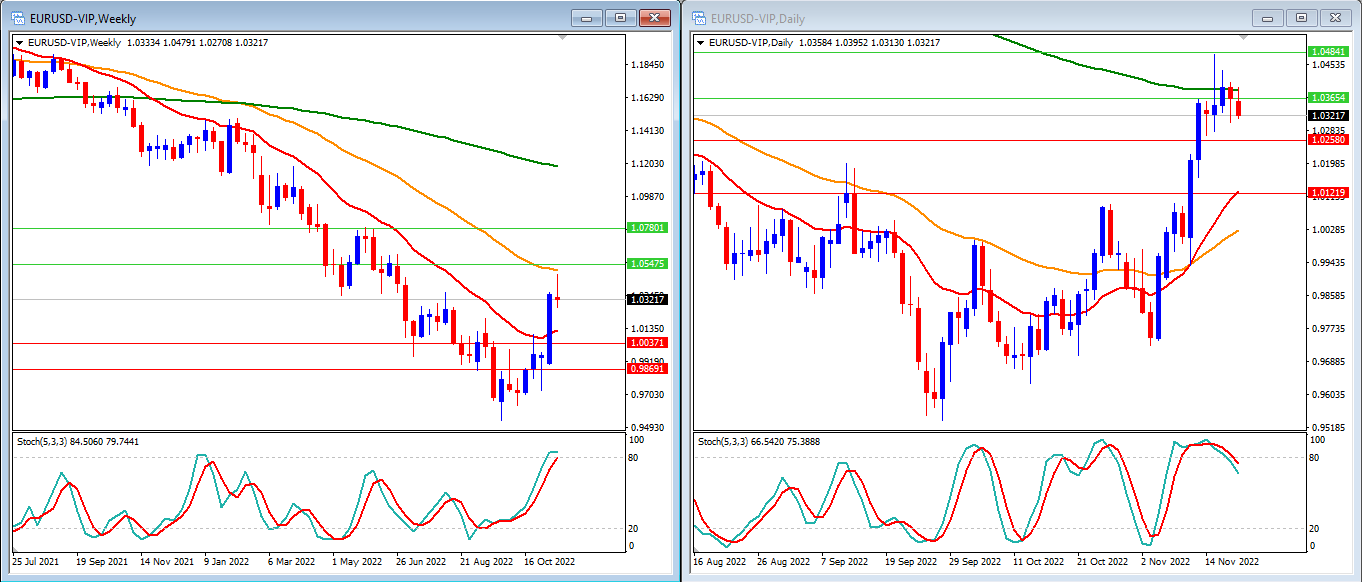
Last week, we expected EURUSD to rise higher and reach our weekly 50-period moving average and daily 200-period moving average. EURUSD moved higher but could not reach our weekly 50-period moving average.
Meanwhile, the Stochastic Indicator is progressively rising on the weekly timeframe, indicating that upward movement is trying to continue. The price continues to trade below the 50, and 200-period moving averages and moving above the 20-period moving average.
Our Weekly resistance levels are now at 1.0547 and 1.0780, with the support levels at 1.0037 and 0.9869.
On our daily timeframe, we can see that our stochastic indicator is exiting the overbought level. Price is moving back below the 200-period moving averages, but it is moving above the 20 and 50-period moving averages.
Our Daily resistance levels are now at 1.0365 and 1.0484, while the support levels are at 1.0258 and 1.0121.
Conclusion: With some services and manufacturing PMI data from the Eurozone, the EURUSD might move lower to touch back our weekly 20- period moving average at 1.0119, which means breaking all our support levels.
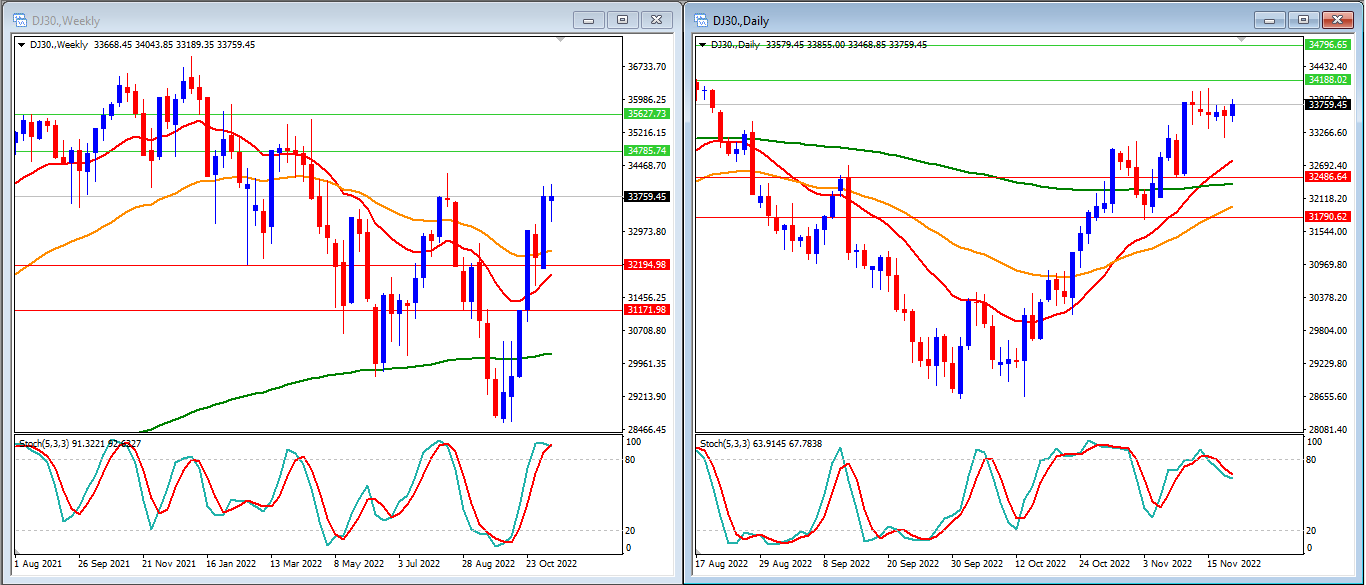
Last week, we expected that DJ30 would move higher to our daily resistance level before moving slightly lower. DJ30 has been moving flat for the whole last week.
On the Weekly timeframe, we can see that the Stochastic Indicator is inside the overbought level and starting to cross. The price is now above all the 20, 50 and 200-period moving averages.
Our Weekly resistance levels are now at 34785 and 35627, with the support levels at 32194 and 31171.
On our daily timeframe, we can see that our stochastic indicator is moving out from the overbought level and starting to move lower. The price is moving above the 20, 50 and 200-period moving averages.
Our Daily resistance levels are at 34188 and 34796, while the support levels are at 32486 and 31790.
Conclusion: With little vital data for this week, markets are waiting for the FOMC Meeting minutes to be released. We expected that DJ30 would move to our weekly 20 and 50-period moving averages at 32531.

Last week, we expected the USOUSD to rise to our daily resistance levels of 89.95 and 92.20. Unable to do so, USOUSD (WTI) fell last week after Concerns over falling demand in China, the world’s largest oil importer, and future interest rate increases by the US Federal Reserve drove oil prices lower. USOUSD closed the week at 80.11.
On the Weekly timeframe, we can see that the Stochastic Indicator is still rising but starting to cross below. The price is moving below the 20 and 50-period moving averages while above the 200-period moving average.
Our Weekly resistance levels are at 85.07 and 92.81, with the support levels at 76.09 and 70.11.
On our daily timeframe, we can see that our stochastic indicator is moving near the oversold level while the price moves back below the 20, 50 and 200-period moving average.
Our Daily resistance levels are 81.52 and 85.73, while the support levels are 76.09 and 72.86.
Conclusion: We are expecting good news from China. We expect the USOUSD to keep moving lower to reach our daily support at 81.50.

Last week, we expected that NAS100 would continue increasing to reach our daily and weekly resistance levels. But the price was moving flat and only closed the week at 11687.
On the Weekly timeframe, we see the Stochastic Indicator moving higher. The price is still moving below the 20 and 50 moving averages and breaking above the 200-period moving average.
Our Weekly resistance levels are at 12159 and 12714 (50-period moving average), with the support levels at 11575 and 11057.
Our daily timeframe shows that our stochastic indicator also moves lower after exiting the overbought level. Price is still moving above the 20 and 50-period moving averages but below the 200-period moving average.
Our Daily resistance levels are at 12179 and 12575, while the support levels are at 11314 and 10902.
Conclusion: With little important data for this week, markets are waiting for the FOMC Meeting minutes to be released. We expected that NAS100 would continue to move lower before going back up.

Last week, we expected GBPUSD to rise higher to reach our daily resistance level at 1.2000 and was able to do so because of the UK CPI data.
On the Weekly timeframe, we can see that the Stochastic Indicator is inside the oversold level and preparing to cross lower. The price still moves above the 20-period moving average but below the 50, and 200-period moving averages.
Our Weekly resistance levels are at 1.2099 and 1.2279, with the support levels at 1.1406 and 1.1074.
We can see that our stochastic indicator is now exiting the overbought level on the daily timeframe. Price is moving above the 20 and 50-period moving averages, but it is still below the 200-period moving average.
Our Daily resistance levels are at 1.2000 and 1.2250, while the support levels are at 1.1711 and 1.1468.
Conclusion: For this week, we can see that GBPUSD might move lower because of little data. We expect GBPUSD to move lower to reach our daily support level of 1.1711.

Last week, we expected that USD Index might move lower to reach our support level and daily 200-period moving average at 105.47. The USD Index fell slightly, was rejected by our daily 200-period moving average, and closed at 106.85.
On the Weekly Time Frame, we see that the Stochastic Indicator is moving lower, entering the oversold level. Price is moving below the 20-period moving average but still above the 50 and 200-period moving averages.
Our Weekly resistance levels are 107.94 and 109.94, with the support levels at 104.81 and 101.62.
Meanwhile, the Stochastic Indicator exited the oversold level on the daily timeframe. Price is now trading below the 20 and 50-period moving averages but remains above the 200-period moving average.
Our Daily resistance levels at 108.20 and 109.23, with the support levels at 105.47 and 104.50.
Conclusion: With the lack of essential data this week, the market’s focus is now on FOMC meeting minutes, which will show the importance of recent data. We expect that USD Index to increase to reach our weekly resistance level of 107.94.

Last week we expected to see USDJPY move lower to reach our daily support levels at 137.53 and 135.82. USDJPY reached our 1st daily support resistance at 137.53 before closing the week at 140.36.
On the Weekly timeframe, we can see that the Stochastic Indicator is moving lower, strongly entering the oversold level. The price moves at the 20-period moving average but remains above the 50 and 200-period moving averages.
Our Weekly resistance levels are at 140.33 and 145.15, with the support levels at 133.39 and 130.80.
On the daily timeframe, the stochastic indicator exits the oversold level. Price is moving below the 20 and 50-period moving averages but above the 200-period moving average.
Our Daily resistance levels are 141.50 and 145.02, while the support levels are 137.53 and 135.82.
Conclusion: With the the lack of essential data this week, the market’s focus is now on FOMC meeting minutes, which will show the importance of recent data. We expected that USDJPY would move higher this week and try to reach our daily resistance level at 141.50 before returning lower.