Spreads
Spreads
Spreads
Spreads
Spreads
Last week’s data was light, with CPI increases in New Zealand, Canada, and the UK.
Meanwhile, UK Prime Minister Lizz Truss has resigned after only 44 days in office.
This increased market volatility, as 2did news from Federal Reserve members calling for the Fed to act more aggressively at their next meeting.
The USDJPY price surged past the critical 150.00 level, sparking talk of a Bank of Japan intervention; however, no such action has yet occurred.
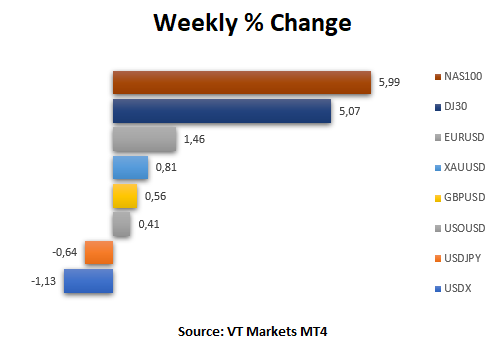
After a lack of data last week, the USD index (USDX) fell 1.13 % for the week, and there is concern that the Fed may decrease the pace of its rate hikes.
(All data taken from the MT4 VT Markets)
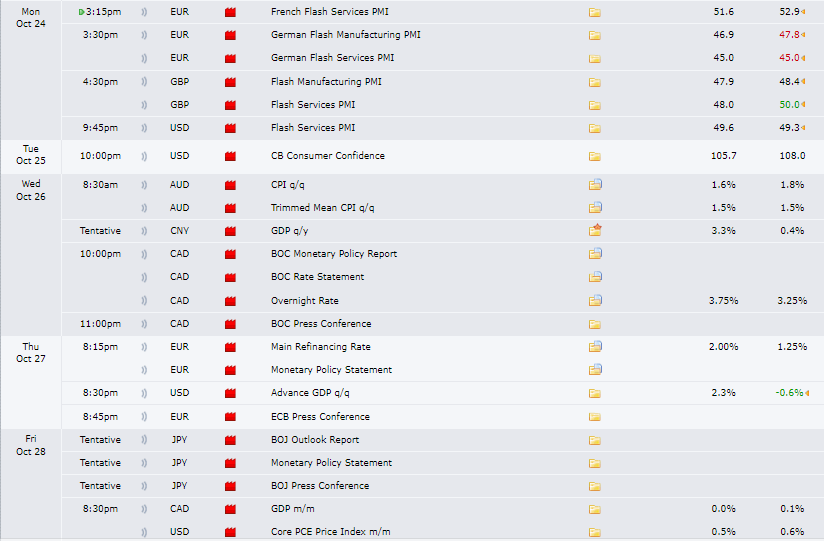
(Picture taken from forexfactory.com)
The Bank of Canada, the European Central Bank, and the Bank of Japan will announce their interest rate decisions this week. All three banks are expected to increase their rates to curb inflation.
The US will also release its Flash Services PMI, Advance GDP, and Core PCE Price Index, while the UK and the Eurozone will have their Flash Services PMI and Manufacturing PMI available.
Australia will also release its Consumer Price Index and Canada its Gross Domestic Product data.
Flash Services and Manufacturing PMI in the Eurozone, UK, and the US | 24th October 2022
Flash Services PMI in France for October is forecast to drop slightly to 51.9 from 52.9 in September; Germany may see a decrease from 45 to 44.8.
Analysts also predict UK Flash Services PMI to remain unchanged at 50 and US to increase from 49.3 to 50.
Flash Manufacturing PMI in Germany for October is forecast to move lower to 47 from 47.8 in September. The UK may see an increase to 48.4 from 47.5.
US CB Consumer Confidence | 25th October 2022
The US CB Consumer Confidence Index increased to 108 in September 2022 from 103.6 in August, showing strong confidence from US consumers.
Analysts expect Consumer Confidence in the US to slow down to 106, but data may still be above 100, indicating that US consumer confidence is good.
Australia Consumer Price Index | 26th October 2022
The Consumer Price Index in Australia increased by 1.80% in the 2nd Quarter of 2022 over the previous Quarter.
Analysts expect that Consumer Price Index for the 3rd Quarter will be lower at around 1.1% to 1.5%.
Bank of Canada Rate Statement | 26th October 2022
The Bank of Canada increased the target for its overnight rate by 75bps to 3.25% in September 2022.
Policymakers said interest rates would need to rise further given the inflation outlook, resulting in this month’s forecast that Canada’s overnight rate will further increase by another 50bps to 3.75%.
ECB Press Conference and Interest Rate Decision | 27th October 2022
The European Central Bank raised rates by a bigger-than-expected 75bps in September, signalling further hikes in the coming months.
The market is already priced at a further 75bps increase in October to 2%.
US Advance GDP | 27th October 2022
The US economy contracted an annualised 0.6% in Q2 2022, matching the second estimate and confirming the economy is in a technical recession.
Analysts expect a 2% increase in the 3rd Quarter of 2022.
Bank of Japan Outlook Report | 27th October 2022 (tentative)
The Bank of Japan retained its key short-term interest rate at -0.1% and signalled to deliver more hikes in future meetings.
Even though inflation in Japan has been in the range of 2.5 to 3%, and the Yen hit its weakest level in more than 20 years, we still expect that the interest rate will remain unchanged at -0.1%.
Canada’s Gross Domestic Product | 28th October 2022
In July, the GDP increased by 0.1%, the same pace as in June.
GDP may be slower at 0% in August.
US Core PCE Price Index | 28th October 2022
Core PCE prices in the US, excluding food and energy, went up by 0.6% in August 2022, rising from the revised stall in the previous month.
For September, analysts expect that Core PCE prices will be at 0.4%.
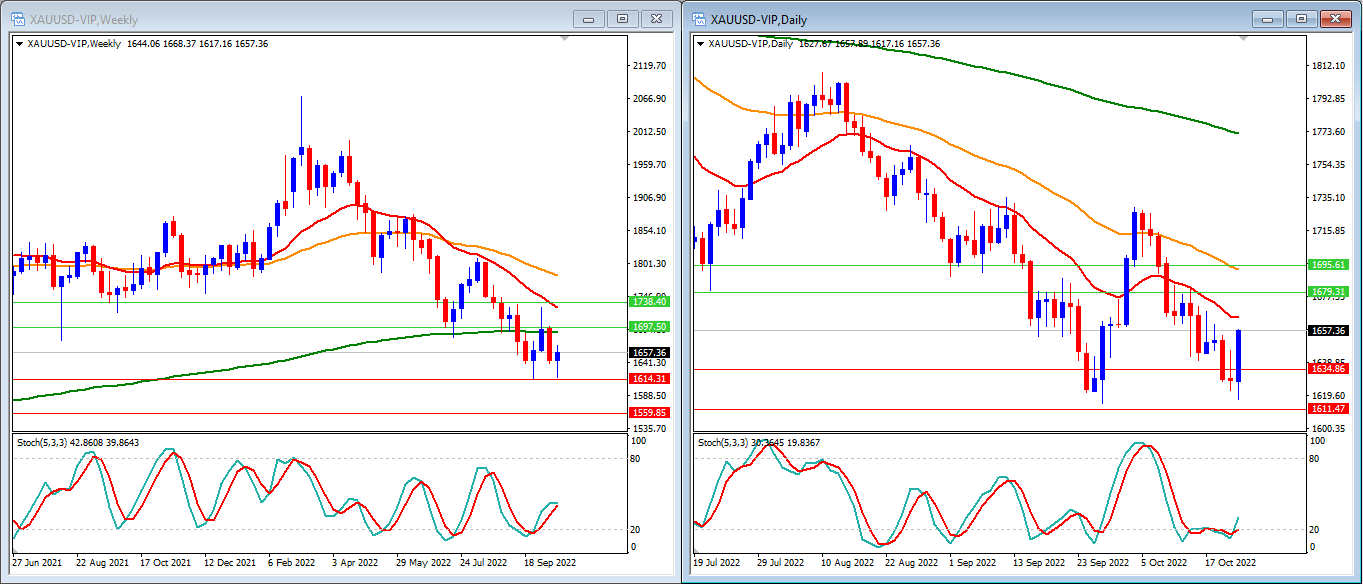
Gold prices increased this week because of a weaker US$, then rebounded after reaching our support level of $1,614.
On a weekly timeframe, we can see that the Stochastic Indicators have just crossed over the oversold level, indicating that gold is about to increase. Gold prices will attempt to return to the 200-candle moving average.
Our Weekly resistance levels at $1,697, and $1,738 with the support levels at $1,614, and $1,559.
Meanwhile, on a daily timeframe, we can see that the Stochastic Indicators are exiting the oversold zone, indicating that the trend will likely change if gold can maintain its strong move in the following days. We can also see that the price is currently below but is beginning to return towards the 20, 50, and 200-candle moving averages, indicating that the price may begin to climb higher despite the market’s selling dominance.
Our Daily resistance levels at $1,679 and $1,695, with the support levels at $1,634 and $1,611.
Conclusion: Given this week’s lack of US data, we may expect gold to regain its demand in the short term while we wait for further US data. We expect that gold will attempt to reach the 20 and 50-candle moving averages daily in the $1,664 – $1,693 range.

The EURUSD price gained last week due to a lower US dollar, reaching our resistance levels on both the weekly and daily timeframes and ending the week at 0.9860.
The Stochastic Indicator is progressively rising in the Weekly timeframe, but the price remains within the downward channel movement, indicating that upward movement is still limited. The price continues to trade below the moving averages of the 20, 50, and 200 candles.
Our Weekly resistance levels are at 0,9860 and 1.0090, with the support levels at 0.9625 and 0.9533.
On our daily timeframe, we can see that our stochastic indicators are lower after hitting the overbought level, indicating that the EURUSD may have peaked its short-term upward movement. Price is still trading below the 50- and 200-candle moving averages, but it has broken above the 20-candle moving average.
Our Daily resistance levels are at 0.9872 and 0.9940, while the support levels are at 0.9666 and 0.9550.
Conclusion: With the ECB rate decision, monetary policy this week, and some Flash Services and Manufacturing Data from the Eurozone, we may see some positive results in EURUSD. We anticipate that the EURUSD will attempt to break through our resistance level of 0.9872 and go higher to the 0.9940 level.
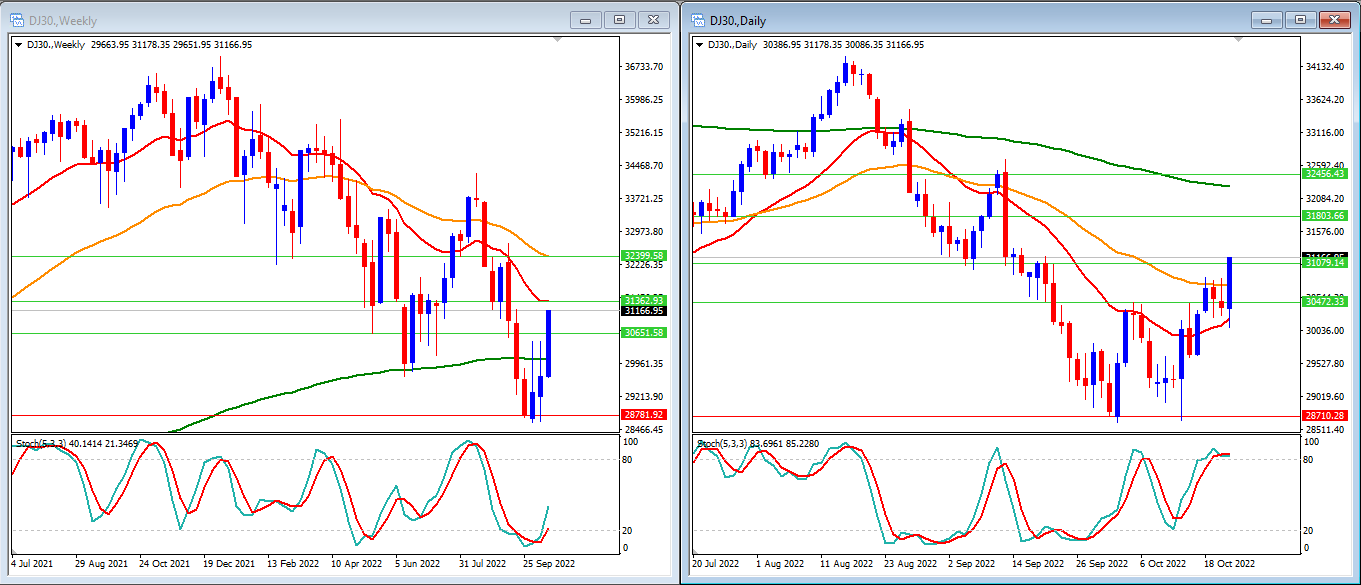
Last week, US stocks rose to end a turbulent week positively. The DJ30 broke our resistance levels and ended the week at 31166.
We can see the Stochastic Indicator exiting the oversold zone on the Weekly timeframe. The price moves below the moving average of 20 and 50-candle but can break back above the 200-candle moving average.
Our Weekly resistance levels are at 31362 and 32399, with the support levels at 30651 and 28781.
On our daily timeframe, we can see that our stochastic indicators are inside the overbought level and trying to exit and move lower. Price is now moving above the 20 and 50-candle moving average.
Our Daily resistance levels are at 31803 and 32456, while the support levels are at 30472 and 28710.
Conclusion: Since we are entering the earnings season, we can expect some positive movement in the market. We can expect that DJ30 will move higher to reach our weekly resistance level at 31362.
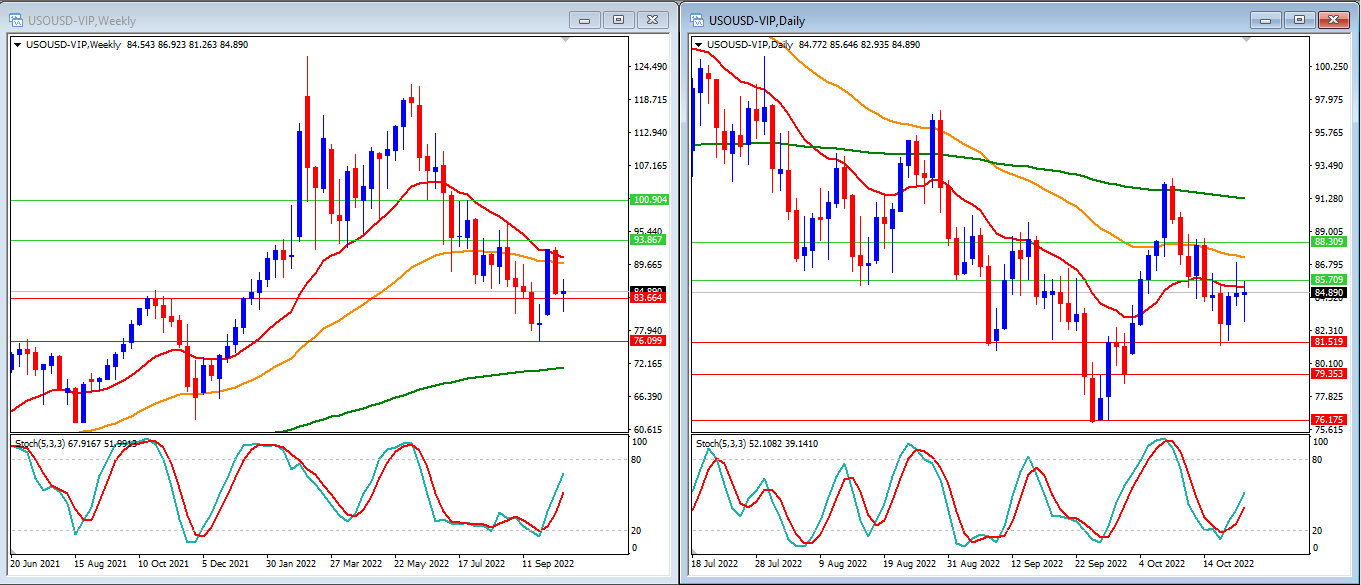
Last week, USOUSD (WTI) was up for the week following after reaching our support level at 83.66 and 81.51 as expectations of stronger Chinese demand and a lower US dollar overshadowed concerns about a global economic downturn, ending the week at 84.89.
On the Weekly timeframe, we can see that the Stochastic Indicator is rising. The price is moving below the 20 and 50-candle moving averages and above the 200-candle moving average.
Our Weekly resistance levels are at 93,86 and 100,90, with the support levels at 83,66 and 76,09.
On our daily timeframe, we can see that our stochastic indicator is also rising. Price still moves below the 20, 50, and 200- candle moving average.
Our Daily resistance levels are at 85,70, and 88,30, while the support levels are at 81,51, 79,35 and 76,17.
Conclusion: Since we are still feeling the effects of the supply cut decision and rising demand in China, we anticipate some positive market activity. Following the strong stochastic indicators from both the weekly and daily timeframes, we expect the USOUSD to advance higher, reaching our resistance levels of 85.70 and 88.30 before reaching the weekly 50-candle moving average of 89.85.

Last week, US stocks rose to end a turbulent week positively. The NAS100 reached our weekly resistance level at 11333.
On the Weekly timeframe, we can see that the Stochastic Indicator is inside but looking to move higher to exit the oversold level. The price is still below the 20, 50, and 200- candle moving average.
Our Weekly resistance levels are at 11333 and 12159, with the support levels at 10836 and 10350.
On our daily timeframe, we can see that our stochastic indicators touched the overbought level yet crossed down to expect lower movement. Price is still moving below the 50 and 200-candle moving averages but trying to break above the 20-candle moving average.
Our Daily resistance levels are at 11667 and 11974, while the support levels are at 10677 and 10315.
Conclusion: Since we are entering the earnings season, we can expect some positive movement in the market. We expect that NAS100 will increase to reach some of our weekly 200-candle moving averages at 11566 and our daily resistance level at 11667.

Last week, the GBPUSD set a weekly increase after UK Prime Minister Lizz Truss announced her resignation after only 44 days in office. It reached our weekly resistance level at 1.1411.
On the Weekly timeframe, we can see that the Stochastic Indicator is rising higher, indicating a significant upward momentum. The price is still below the 20, 50, and 200-candle moving averages.
Our Weekly resistance levels are at 1.1411 and 1.1755, with the support levels at 1.0795 and 1.0300.
On our daily timeframe, we can see that our stochastic indicators are going back lower, but the price is moving higher. Price attempts to break above the 20-candle moving average and between the 20 and 50-candle moving averages but remains below the 200-candle moving average.
Our Daily resistance levels are at 1.1462 and 1.1735, while the support levels are at 1.0925 and 1.0650.
Conclusion: Markets are still waiting for the decision and policy after Lizz Truss’s resignation. We expect to get some consolidating movement this week. We expect GBPUSD to move inside the range between the daily 20 and 50-candle moving average with a higher expectation to break our weekly resistance level at 1.1411.

Last week, the USD index (USDX) fell as lack of data release, and there is concern that the Fed may decrease the pace of its rate hikes. It reached our daily resistance level of 113.79 before going back lower, trying to reach our daily support level of 111.47.
On the Weekly Timeframe, we can see that the Stochastic Indicator has exited the overbought level with a slower motion. The price remains above the 20, 50, and 200-candle moving averages.
Our Weekly resistance levels are at 113.83 and 115.35, with the support levels at 110.82 and 107.97.
Meanwhile, at the daily timeframe, we can see that the Stochastic Indicator shows a rising movement after being unable to reach the oversold level. Price is still above the 50 and 200-candle moving averages but trying to break below the 20-day moving average.
Our Daily resistance levels are at 113.79 and 114.75, with the support levels at 111.47, 110.76 and 109,96.
Conclusion: With a slow market for last week and a lack of data for this week, we will see some consolidating movement in the USD Index. Some data, such as Consumer Confidence and Flash Services PMI, might create some volatility. We expect the price to move between the daily support and resistance in the 111.47 to 113.79 range.
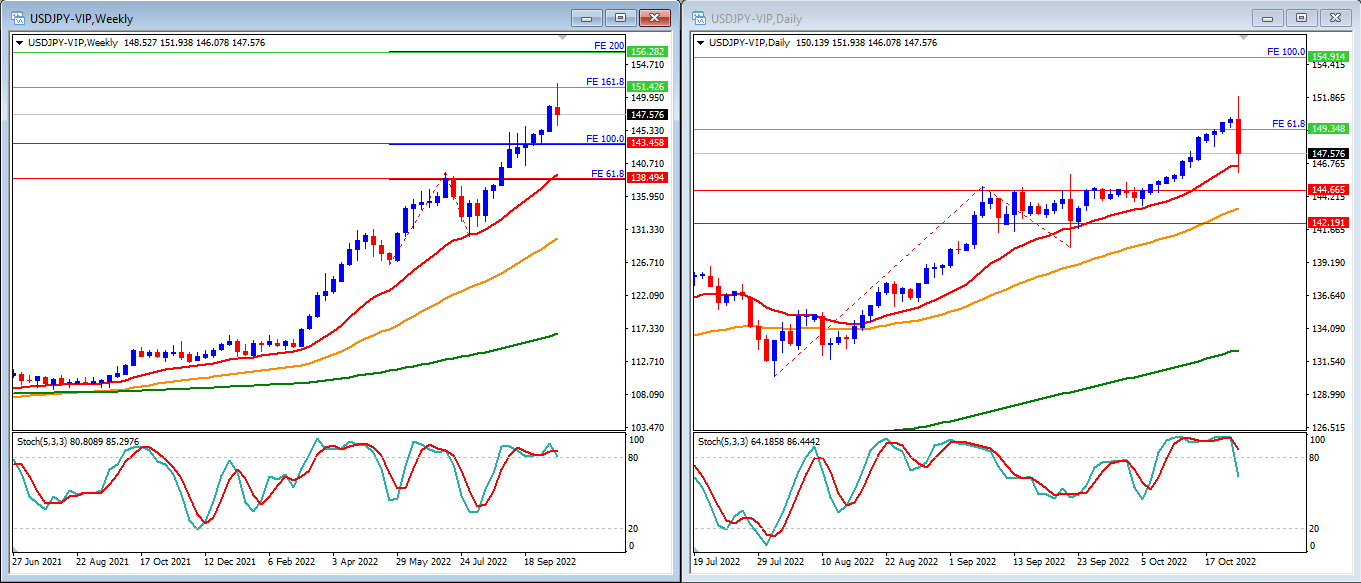
USDJPY ended the week lower after a higher movement caused by a weak JPY. It reached our weekly resistance level of 151.42. Japan’s plan to intervene in the forex market and the USD weak helped the USDJPY to move lower and end the week at 147.57.
On the Weekly timeframe, we can see that the Stochastic Indicator is inside the overbought zone, with a potential lower movement. The price is still moving above the 20, 50, and 200-candle moving averages.
Our Weekly resistance levels are 151.42 and 156,28, with the support levels at 143,45 and 138,49.
We can see that the stochastic indicator is exiting the overbought level on the daily timeframe. Price remains above the 20, 50, and 200- candle moving average, with the price unable to break below the 20-candle moving average.
Our Daily resistance levels are 149.35 and 154.91, while the support levels are 144.66 and 142.19.
Conclusion: We are still waiting for Japan’s intervention in the forex market, especially if USDJPY is back to reaching the 150 level. We expect that USDJPY might move lower after knowing the Bank of Japan’s monetary policy decision. The price might move lower, breaking below the daily 20-candle moving average to reach our daily support at 144.66 and weekly support at 143.45.