Spreads
Spreads
Spreads
Spreads
Spreads
Throughout 2022, the market has been preoccupied with various occurrences that have contributed to an unstable global economy. The conflict between Russia and Ukraine, worsened by sanctions imposed by the US and the European Union, has slowed the worldwide pandemic recovery process. The war resulted in a major supply shock that drove up commodity prices. This adds to the burden of a very high inflation rate caused by a recovering economy and disruptions in the supply chain.
Central banks worldwide have been forced to tighten their financial restrictions to combat inflation. This means that they will have to adjust the loose liquidity/monetary policies seen during the pandemic sooner than anticipated to contain rising inflationary pressures. They are also increasing interest rates in synchronisation, which has not happened in recent decades.
In the last quarter of 2022, the global economic situation appears to be hampered by numerous uncertainties.
There are still several risk factors that have the potential to impede global economic growth. These risk factors include geopolitical tensions that have not subsided and inflation that is still very high and has not shown signs of cooling, forcing the central bank to constantly raise interest rates and increasing the possibility of the economy entering a recession. We also have to consider the conditions in one of the world’s largest economies, China, which continued its zero-COVID policy, resulting in slower-than-expected economic growth. A slowdown in the greatest economy in the world will have enormous effects on the global picture.
The US Federal Reserve has just raised interest rates by 75bps, marking the fifth hike since March 2022. The Federal Reserve is still focused on reducing inflation, which requires a downturn in the labour market. After seeing the US economy slow down in 2021 due to the apparent pressures on various products and services, the Fed will pay closer attention to the data before deciding whether to increase interest rates in the future.
Looking at this, we can still predict that the Fed will raise interest rates in at least one of its meetings in the fourth quarter of 2022, recognising the need for a 100-125bps increase while monitoring economic figures. It needs time to re-establish price stability before slowing down its operations.
Prior to decreasing interest rates, the Fed stated that it must be certain that inflation has started to return to 2%.
Meanwhile, Russia’s invasion of Ukraine in late February 2022 has caused unprecedented instability in the global markets. Both traders and investors were compelled to deal with the financial repercussions. As the situation deteriorates into a lengthy armed conflict, asset prices fluctuate in response to significant occurrences. Unprecedented sanctions, logistical obstacles, and escalation cycles have contributed to periodic insecurity. In addition, the geopolitical conflict has significantly impacted the world’s commodity, currency, and stock markets.
Even though the Russia-Ukraine War was a regional conflict, its involvement affected commodity markets worldwide. The crude oil and natural gas markets were among the hardest damaged. This condition challenges the prospects for the global economy, particularly in Europe.
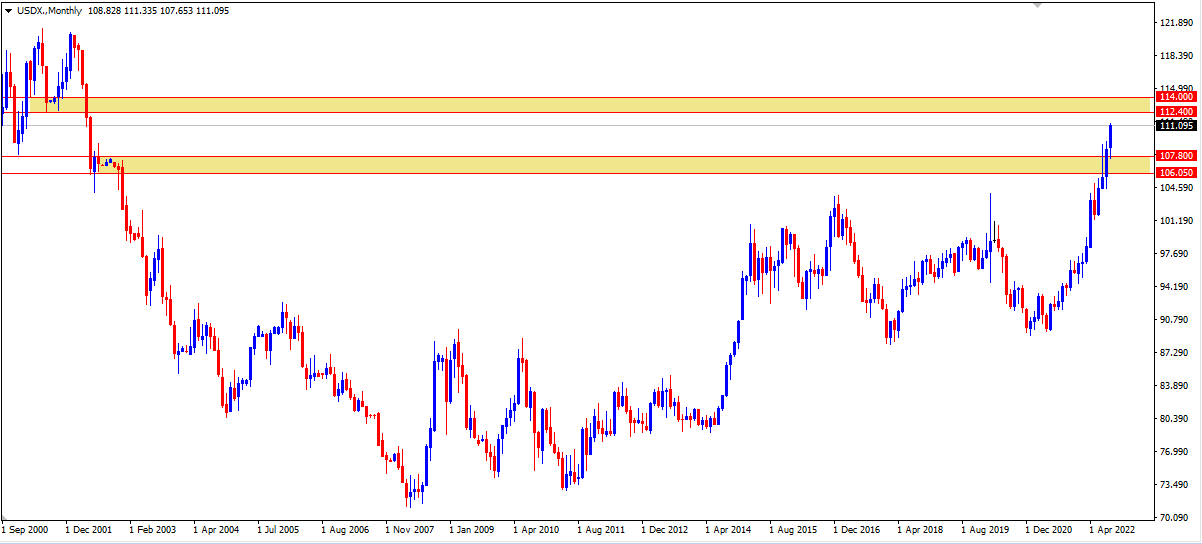
At the time of writing (23 September 2022), USDX is at a level that has not been reached in the previous twenty years, having broken through the resistance area and reaching a very high level. In recent years, the global economy and inflationary conditions compelled the Fed to consistently raise interest rates, resulting in the USD’s strength.
On the monthly timeframe, we have the following support and resistance levels:
Support Levels 106.05 dan 107.80
Resistance levels 112.40 dan 114.00

On a smaller timeframe, we can see the price moving parallel and neatly within an uptrend channel with a potential minor reversal. This is supported by the Stochastic Indicator, which is currently in a possible reversal after exiting the overbought level and moving towards a lower area. For the long-term, however, the price is above the 20.50- and 200-candle moving averages, indicating that the price movement will continue to rise.
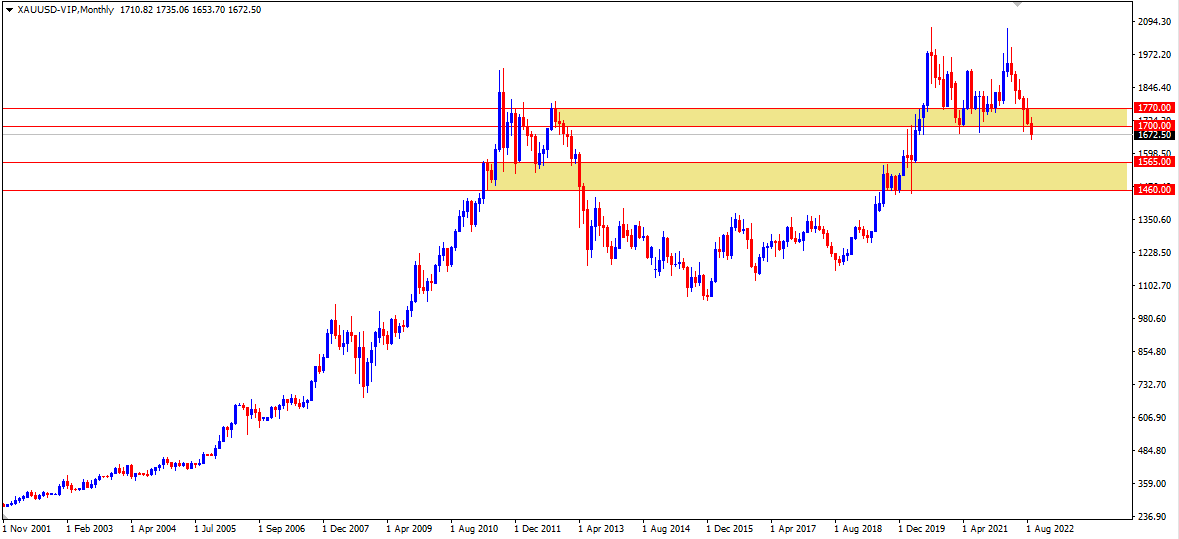
At the time of writing, the price of gold is $1,672, close to the beginning of the epidemic price low last reached in June 2020.
Global inflation impacts gold, causing the Fed to continue raising interest rates, which is still the primary issue, limiting the market’s ability to keep gold as a safe-haven asset.
Technically, gold prices may return to pre-pandemic levels in Q4 2022. This is disappointing news for markets that hold gold assets, but it indicates that the Gold market has returned to “normal” pricing before the “pandemic” price.
Monthly support and resistance levels are displayed below.
Resistance: $1,700 and $1,770
Support: $1,565 and $1,460
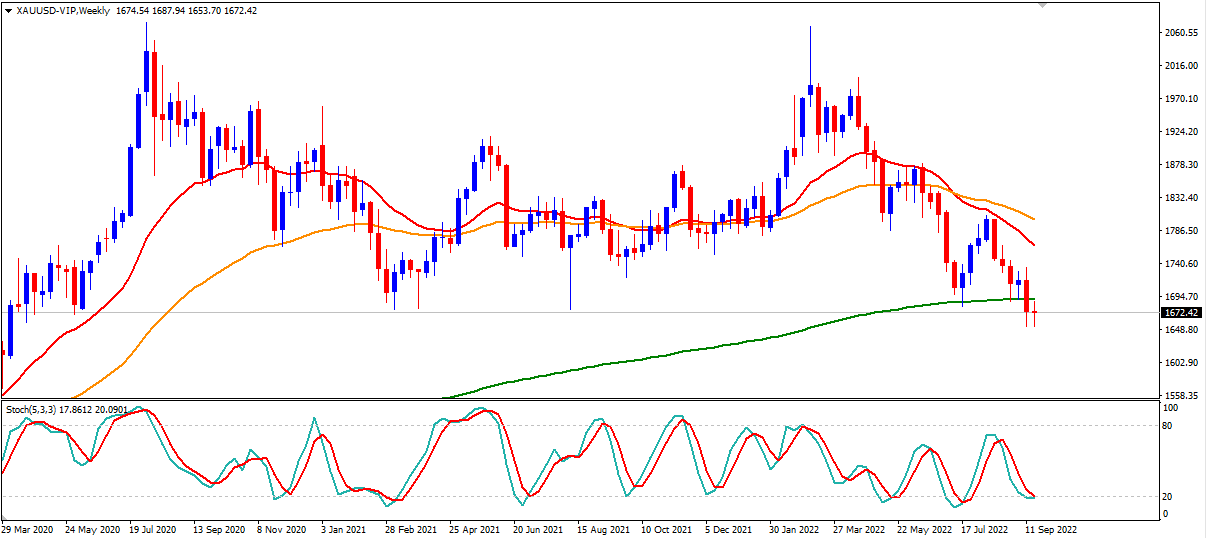
If we check the stochastic indicator, which has reached the oversold region, we can see a minimal opportunity for gold to rise higher in the weekly timeframe. However, if we check the price, which has broken through the 200 Moving Average, we can see a greater possibility for gold to continue falling.
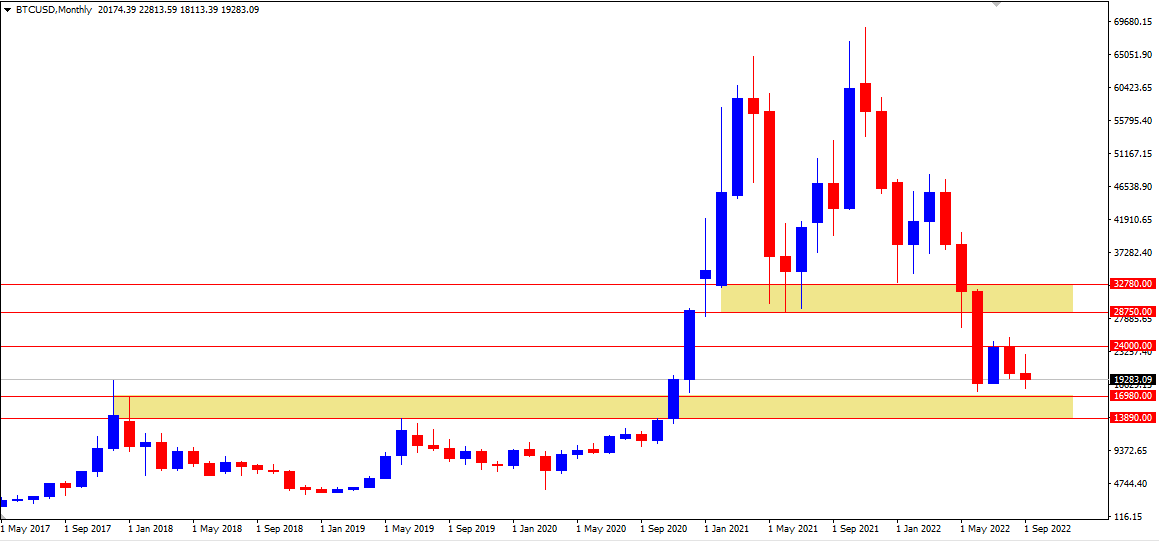
Bitcoin is currently trading below the $20,000 barrier. The price level on the present market is $ 20,000, which correlates to the movement over the past two months, which has been a range-bound movement at a narrow level.
If we check the monthly timeframe, we can see that the market is currently stuck at its pre-pandemic high of $19,255, which is quite valued by the market during this period of uncertainty.
Bitcoin, which is affected by market antipathy to assets, runs the risk of becoming an additional test for Bitcoin to demonstrate its status as an investment instrument. Bitcoin’s fall from $47,000 since the beginning of the year indicates that the market has not been brave enough to re-enter the instrument that was previously the best option during the pandemic.
The fourth quarter of 2022 will test the $20,000 level. Is it going to be left for bitcoin to fall further by breaking the current support region or to rise again above the key $24,000 level?
Support: $16,980 and $13,890
Resistance: $24,000, $28,750, and $32,780

On a weekly timeframe, Bitcoin’s price fluctuation is not described by a clear trend. The stochastic indicator is attempting to rise above the oversold level. Still, the price is being held back by the 200-candle moving average and the downward movement of the 20- and 50-candle moving averages.
Inflation that continues to rise in the United States is causing market concern. The conditions experienced by many companies in the United States significantly impact the price movements of several indexes.
In the last two months, when the Fed has taken more aggressive actions to combat inflation, the Indices have fallen to the same level as last year (2021).
Entering Q4 2022, the market is extremely concerned about rising inflation, especially given the FED’s intention to hike interest rates by 100-125 basis points at the end of the year.
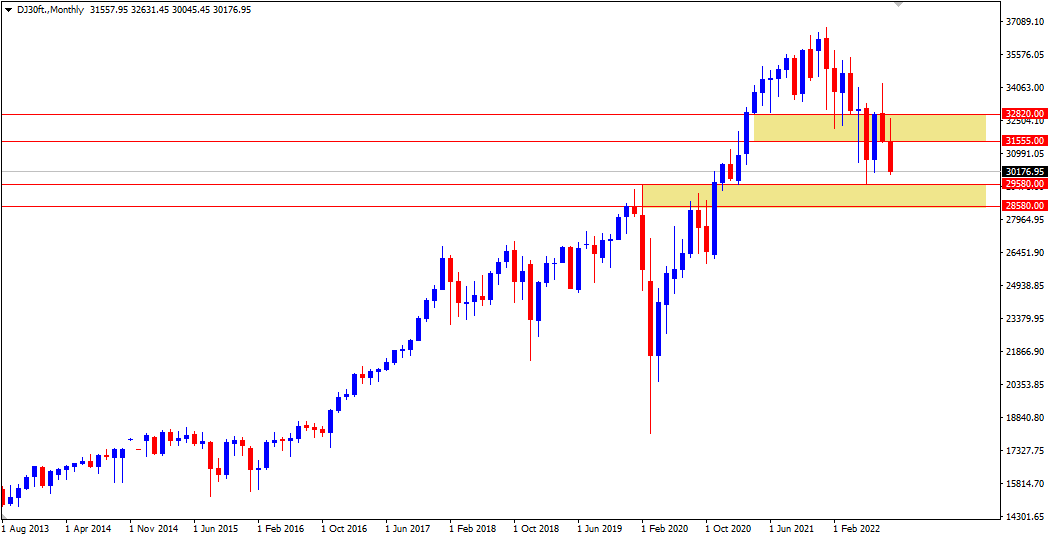
Technically, we can see on the monthly timeframe that the price is moving closer to the support level below 30,000, entering the support zone that might determine whether the price slide can be halted or extended.
Support 28,580 and 29,580
Resistance: 31,555 and 32,820

At the time of writing (23 September 2022), the price is near the 200-candle Moving Average on the weekly timeframe. The Stochastic Indicator is approaching the oversold level, indicating that the price will likely climb again. The picture on both monthly and weekly timeframes suggests the market is discounting prices, meaning that the potential for prices to rise again is rather open.

While on the Nasdaq, we can also notice on the monthly timeframe that the price is approaching the support level and entering the support area, which might determine whether the price slide can be halted or continues.
Support 10,900 and 11,390
Resistance: 12,290 and 12,625
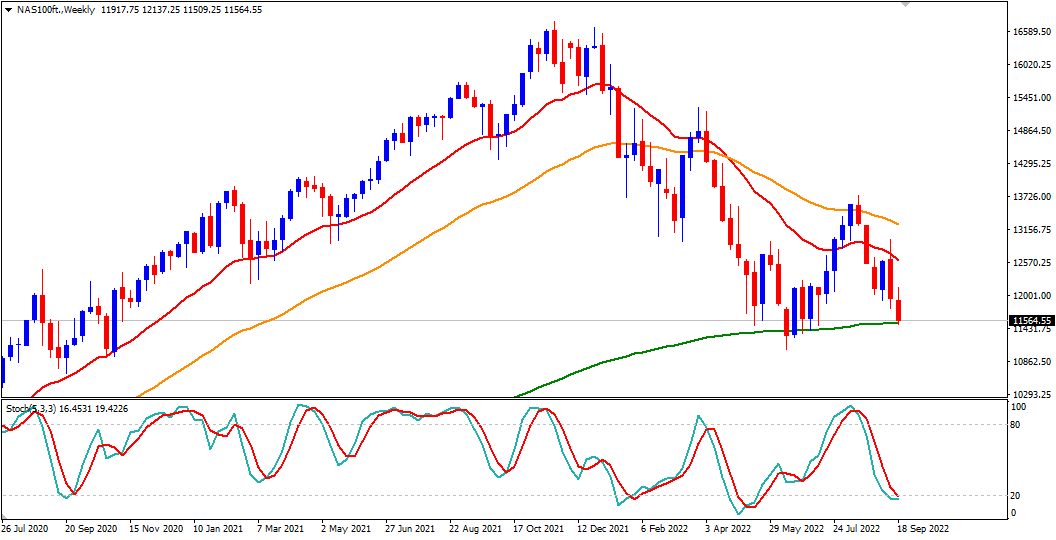
While the same possibility exists on a weekly timeframe, at the time of writing (23 September 2022), the price is at a position where it is highly likely to climb again, as the 200-candle Moving Average and the Stochastic are entering the oversold zone. The picture on both monthly and weekly timeframes indicates that the market is discounting prices, indicating that the potential for prices to rise again is rather open.

The SP500 is also moving in the same direction as the DJ30 and NAS100, where we can see on the monthly timeframe that the price is moving closer to the support level, entering the support area, which might be the determining factor as to whether the price decrease can be halted or continues to fall.
Support 3590 and 3750
Resistance: 3960 and 4150

While the same possibility exists on a weekly timeframe, the price is currently (23 September 2022) at a level from which it is quite probable to climb again. However, the SP500 price is expected to continue falling toward the 200-candle Moving Average, and the Stochastic indicator is still approaching the oversold level. For a longer potential, however, the price may climb since the market will take advantage when the price is low.
