Spreads
Spreads
Spreads
Spreads
Spreads
Last week, investors expected the USD to regain strength following a brief period of weakness.
The Nonfarm Payroll report was expected to be lower, but it came in higher than expected at 263,000. The average hourly wage remained unchanged, although the unemployment rate dropped from 3.7% to 3.5%. This boosted the USD, causing it to strengthen versus most currencies.
The Reserve Bank of Australia hiked interest rates by 25bps, from 2.35% to 2.60%. This was lower than the expected rise of 2.85%. This upset investors because it is the first central bank to decrease the rate of tightening. The Reserve Bank of New Zealand responded by raising interest rates by 50bps, bringing their rate to 3.50%.

(All data taken from the MT4 VT Markets)

(Picture taken from forexfactory.com)
The US will release several key data items this week, including the inflation data reflected in the Consumer Price Index, the producer price index, and retail sales data. The preliminary consumer sentiment data reported by the University of Michigan and the minutes from the Federal Open Market Committee will also be released.
Meanwhile, the UK will publish its GDP data mid-week.
UK Gross Domestic Product | 12 October
Gross domestic product in the UK grew 0.2% in July from June, rebounding from a 0.6% fall in the previous month.
Analysts forecast that the economy will grow 0.1% in August.
US Producer Price Index | 12 October
US producer prices fell 0.1% in August, following a 0.4% drop in July. According to economists, prices are forecast to remain steady (0%) for September.
FOMC Meeting Minutes | 13 October
In its September meeting, the Federal Open Market Committee increased the federal funds rate by 75bps (3%-3.25% range). The Fed also projected that interest rates will rise to as high as 4.4% by December 2022 and stay at 4.6% in 2023.
US Consumer Price Index | 13 October
According to the Bureau of Labour Statistics, the US consumer price index rose 0.1% in August from July. This follows a flat reading in the previous month and is higher than a forecast decline of 0.1%. Analysts expect that September’s CPI will be up by 0.2%.
US Retail Sales | 14 October
The US retail sales increased by 0.3% in August from July, following a revised 0.4% fall in the previous month. Markets expect retail sales figures to increase by 0.2% in the current month.
Prelim UoM Consumer Sentiment | 14 October
In September, the University of Michigan’s consumer sentiment index was released to be 58.6, revised from 59.5 in a preliminary figure. The index had been above 58.2 in August and at its highest in five months.
Analysts predict a range of figures for the index, with some believing it will surpass 58.5, while others believe it will fall below that level.
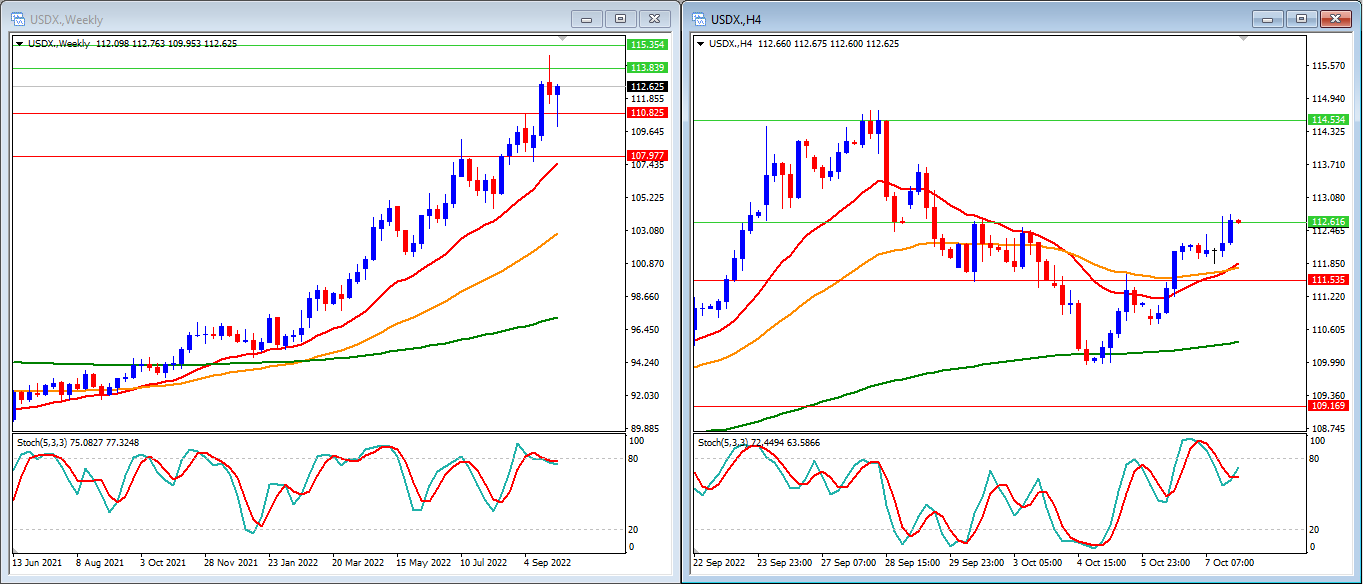
Last week, the USD index (USDX) ended the week with a 0.47% gain after a weak start. We reached our support level of 110,82 before returning to conclude the week at 112,62.
On a Weekly timeframe, the Stochastic Indicator is overbought and starting to reverse. This technically indicates that purchasing power has peaked. The price currently exceeds the moving averages of 20, 50, and 200 candles. This could indicate that the price will rise further this week.
Our Weekly Resistance levels are 113.83 and 115.35, and the support levels are 110.82 and 107.97.
Meanwhile, the Stochastic Indicator on the H4 period is rising. After attempting to break below the 200-candle Moving Average, the price rose above the 20, 50, and 200-candle Moving Averages, indicating that we may see some short-term stronger movement at the start of the week.
Our H4 Resistance levels are 112.61 and 114.53, and the support levels are 111.53 and 109.16.
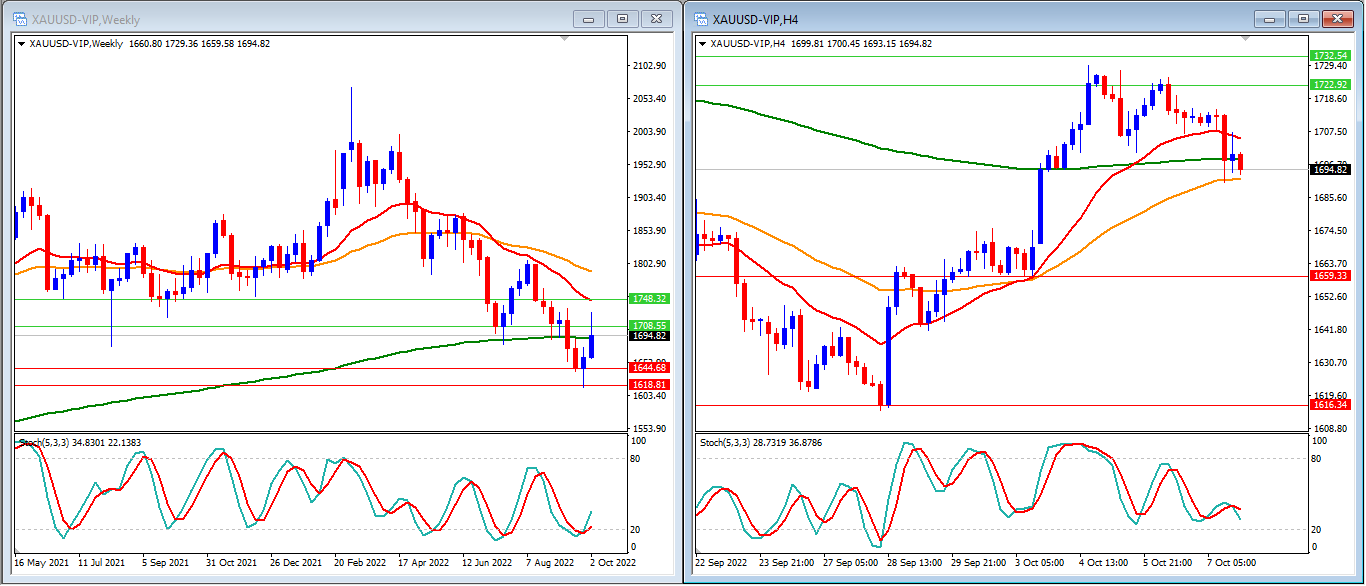
Gold prices rose by 2.05% to $1,708, our resistance level.
On a weekly timeframe, the Stochastic Indicators are inside the oversold zone, indicating a possible reversal. Gold prices attempted to move back above the 200-candle Moving Average, indicating that the price will consolidate before attempting to break it.
Our Weekly Resistance levels at $1,708 and $1,748 with the support levels at $1,644, and $1,618.
The Stochastic Indicators are trending down on the H4 period, indicating that there will be a lower movement in the short term. Meanwhile, the price and the 200-candle moving average moved between the 20 and 50-candle moving averages, indicating that the price is continuing to consolidate.
Our H4 Resistance levels at $1,722 and $1,732, with the support levels at $1,659 and $1,616.
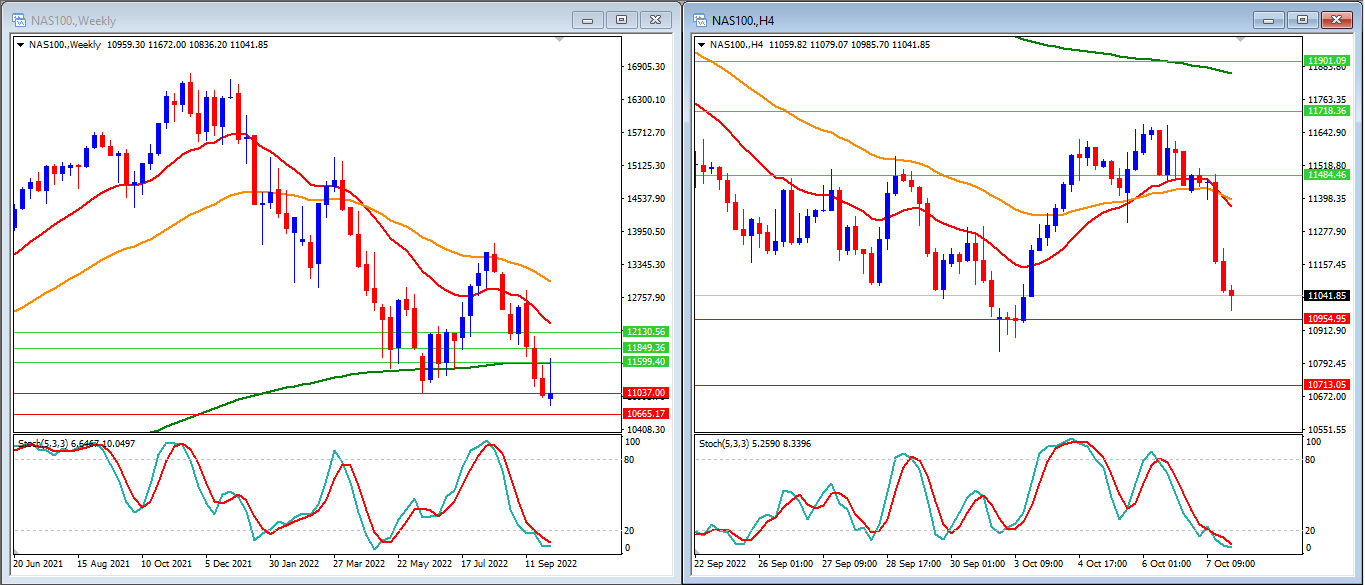
Last week, US stocks rose at the start of the week before falling back at the end. Our NAS100 support level has now reached 11037.
On the Weekly timeframe, the Stochastic Indicator is moving down within the oversold area, while the price is moving below the 20, 50, and 200-candle moving averages, indicating that the price may continue to fall and use the 200-candle Moving Average as resistance.
Our Weekly Resistance levels are at 11599 (200 MA), 11849 and 12130, with the support levels at 11037 and 10665.
On our H4 timeframe, we can see that our stochastic indicators are consolidating inside the oversold level and attempting to cross and reverse upward. The price is presently falling below the 20, 50, and 200-candle Moving Averages, indicating the possibility for further decline remains.
Our H4 Resistance levels are at 11484, 11718 and 11901, while the support levels are at 10954 and 10713.
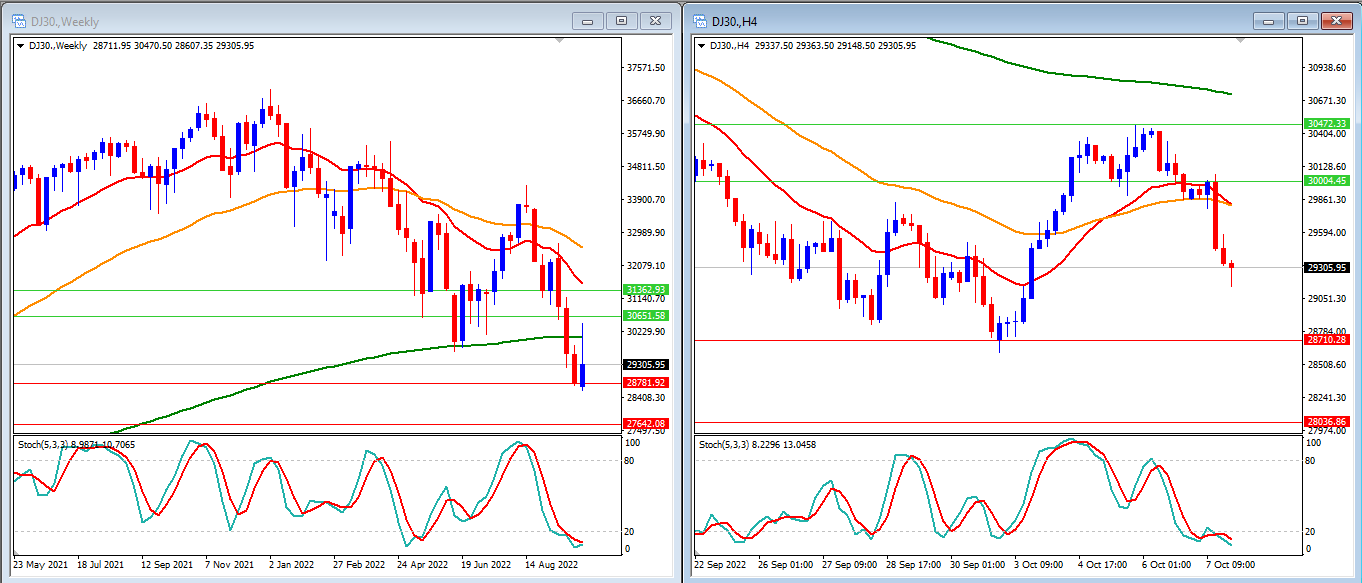
US markets climbed at the start of last week before sliding at the close. Our DJ30 support level has now reached 28781.
On the Weekly timeframe, the Stochastic Indicator is moving lower, approaching the oversold level, while the price is moving below the 20, 50, and 200-candle moving averages, indicating that the price may continue to fall and use the 200-candle Moving Average as resistance.
Our Weekly Resistance levels are at 30651 and 31362, with the support levels at 28781 and 27642.
While on our H4 timeframe, we can see that our stochastic indicators are consolidating within the oversold level and unable to reverse up, but the price is now moving below the 20, 50, and 200-candle Moving Averages, indicating that potential lower movement remains intact. Still, we must be cautious of the short-term upward movement.
Our H4 Resistance levels are at 30004 and 30472, while the support levels are at 28710 and 28036.