Spreads
Spreads
Spreads
Spreads
Spreads
Last week we had multiple central bank announcements from the Reserve Bank of Australia (RBA), Bank of Canada (BoC), and European Central Bank (ECB).
Queen Elizabeth II, the longest-reigning British monarch, died on 8 September. She was 96. The queen passed away peacefully at her estate in Balmoral, Scotland, according to a statement from Buckingham Palace. Her son Charles was to succeed her as King of England, Scotland, Wales and Northern Ireland.
Following the queen’s death, the future of the UK was uncertain, with recurring calls for Scottish independence and Britain’s withdrawal from the European Union exacerbating tensions in Northern Ireland.
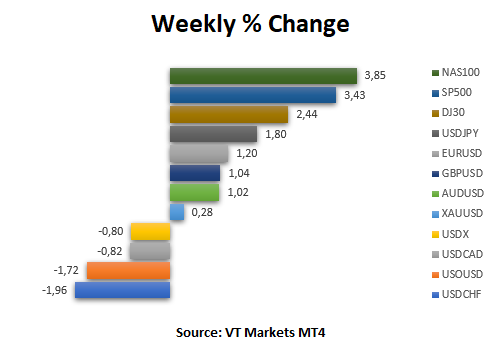
Last week’s US major indexes recorded their first weekly gain in four weeks as investors went on a buying spree, shrugging off concerns about the economic outlook. The gains followed a sharp sell-off that began in mid-August, triggered by concerns about the impact of tighter monetary policies and signs of an economic slowdown in Europe and China. This market recovery was more related to previous overselling as uncertainty remained high about inflation and the Federal Reserve’s aggressiveness in interest rate hikes.
(All data taken from MT4 VT Markets)
(Picture taken from forexfactory.com)
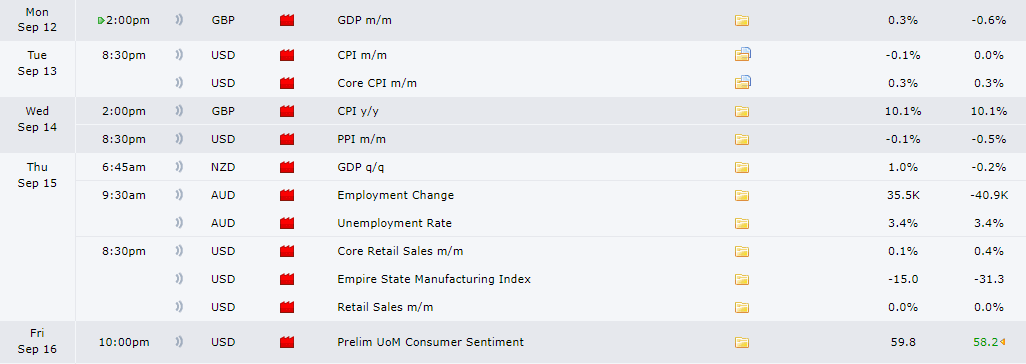
Inflationary data in the US, UK, and Australia will be the main focus this week.
The US will release its Consumer Price Index, Producer Price Index, and Retail Sales data, with the market keeping an eye on these releases after more neutral labour data in the US and the Fed’s decision to raise the interest rate.
Meanwhile, the UK will also release data on CPI, GDP this week. On Thursday, Australia will release its employment data.
The British economy contracted 0.6% month-on-month in June of 2022, following a downwardly revised 0.4% rise in May.
Analysts forecast a -0.1% result in July.
Consumer prices in the US retained in July from June 2022, after rising at a 17-year high rate of 1.3% in the previous period.
Analysts expect July Consumer prices to be slower at -0.1%.
The annual CPI in the UK increased to 10.1% in July of 2022, from 9.4% in the previous period.
Analysts predict the figure to return below 10%.
Producer prices in the US unexpectedly fell 0.5% month-on-month in July of 2022, following a downwardly revised 1% rise in June.
Producer prices are forecast to be higher by 0.1% for August.
New Zealand’s economy shrank by 0.2% on quarter in the three months to March 2022, following a 3% rise in the previous period.
Analysts expect the economy will be better for the second quarter by 1.5%.
Employment in Australia unexpectedly declined by 40,900 to 13.56 million in July 2022, with its unemployment rate suddenly hitting a record low of 3.4%.
For August, we can expect that employment will be positive and the unemployment rate will remain the same.
Retail sales in the US unexpectedly stalled in July of 2022, disappointing markets that expected a 0.1% increase.
This month, markets expect retail sales figures to increase by 0.2%.

Last week, the USD index (USDX) showed another strong movement but ended the week with a lower result. USD Index reached the highest level at 110.76 before closing the week back below 109.
In the weekly timeframe, we can see that Stochastic Indicators are inside the overbought level, indicating a reversal yet to cross. This means the upward movement is slower, with the potential of reversal. Meanwhile, the price is still moving above the 20-, 50-, and 200-candle Moving Averages.
Our Weekly Resistance levels at 109.75 and 110.63, with the Support levels at 108.03 and 104.86.
In the H4 timeframe, we can see that Stochastic Indicators are trying to move up. The price moves below the 20- and 50-candle Moving Averages but still above the 200-candle Moving Average, showing that lower movement is starting.
Our H4 Resistance levels are at 109.75, with the Support levels at 108.21 and 107.52.
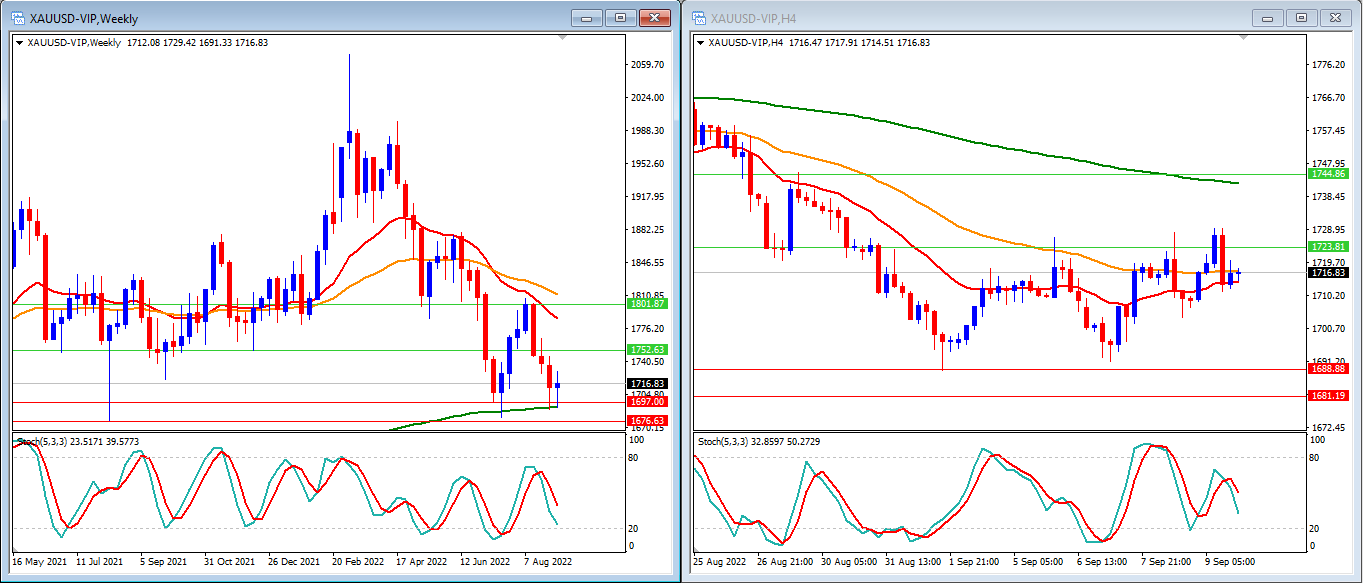
Last week, gold prices moved lower but were rejected at 200-candle Moving Average in the weekly timeframe, the second time in the past few weeks.
In the weekly timeframe, we can see that the Stochastic Indicators show a lower movement, indicating that Gold is moving lower. Gold prices move back above after a back-to-back rejection by the 200-candle Moving Average. However, it is still moving below the 20- and 50-candle Moving Averages, which shows that the price moves in a lower consolidation price. The potential movement will try to reach our Support levels if the price can break lower than the 200-candle Moving Average.
Our Weekly Resistance levels at $1,752, and $1,801 with the support levels at $1,697, and $1,676.
Meanwhile, in the H4 timeframe, we can see that the Stochastic Indicators move back lower after a slight upward movement. The price is moving back above 20- and 50-candle Moving Averages but below the 200-candle Moving Average, indicating that the price will still move lower.
Our H4 Resistance levels are at $1,723 and $1,744, with the Support levels at $1,688 and $1,681.

Last week, US stocks boosted after getting weaker since August for the third week, which shows that some buyers are still willing to enter the market.
We can see that the Stochastic Indicators are dropping in the weekly timeframe. With the price moving below the 20- and 50-candle Moving Averages, we still expect the lower movement to reach our support level at 11849.
Our Weekly Resistance levels are at 12958 and 13583, with the Support levels at 11849 and 11286.
While in our H4 timeframe, we can see that our Stochastic Indicators are inside the overbought level after a strong movement on Friday completed the strong weekly move. The price is moving above the 20- and 50-candle Moving Averages and trying to break above the 200-candle Moving Averages.
Our H4 Resistance levels are at 12551 and 12909, while the Support levels are at 11864 and 11484.

Last week, US stocks boosted after weeks of being weak. This shows that several buyers are still willing to enter the market.
In the weekly timeframe, we see that Stochastic Indicators are moving lower. With the price moving back below the 20- and 50-candle Moving Averages and above the 200-candle Moving Average, we can expect that price has the potential to move between our Support and Resistance levels.
Our Weekly Resistance levels are at 32226 and 32861, with the Support levels at 31274 and 30619.
While in our H4 timeframe, we can see that our stochastic indicators are moving higher after a strong week. The price is moving below the 20-, 50- and 200-candle Moving Average. The movement is strong, indicating that the DJ30 might go higher in the short term.
Our H4 Resistance levels are at 32459 and 33086, while the Support levels are at 31089 and 30599.