Spreads
Spreads
Spreads
Spreads
Spreads

You can’t trade without fully understanding the market structure.
It has been around for as long as financial markets have existed, and it’s a must for every trader to master how the market structure works so that it’s easier to determine when to buy, sell, or stay out of the markets.
A market structure is essentially the framework from which the current market is trading. It is broadly classified into bullish, bearish, and sideways.
A bullish market means a series of higher highs and higher lows that continues with the same trend until the market shifts.
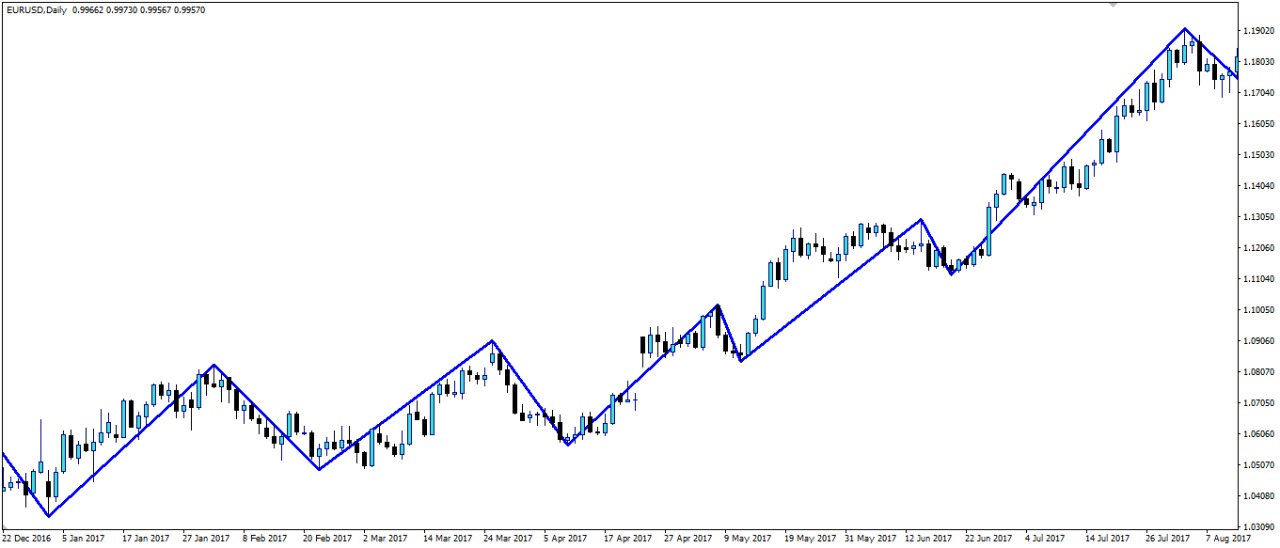
Source: VT Markets MT4
A bearish market means a series of lower lows and lower highs that continue in the same pattern until a higher high is created.
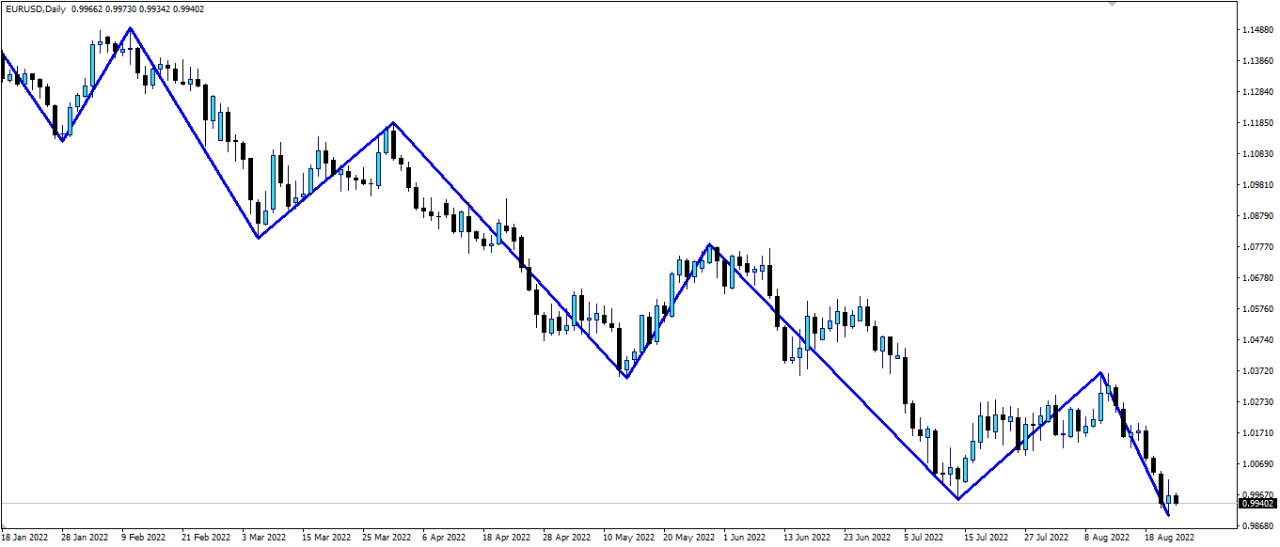
Source: VT Markets MT4
Equal highs and equal lows define a sideways market.

Source: VT Markets MT4
As a trader, you must understand the market structure because of its strong influence on the price movement and liquidity of the market. Even expert traders rely on market structure as one of their most efficient tools in understanding trends, reversals, and a general feel of the current market condition, so they can also decide whether to buy, sell, or sit it out for a while.
The market structure also offers a smart insight into how a market behaves and where price movement is heading so traders can plan their strategies.
There are two distinct ways to identify market structure: the candlestick chart and the moving average.
The candlestick chart is the more popular and efficient option because it allows you to confirm a trend by seeing a series of candlestick patterns above a previous higher high in an uptrend and below an earlier lower low in a downtrend.
When you see this pattern on a candlestick chart, you know that buying continues whether the prices increase. This means that you can also continue buying because there’s a trend going on.
On the other hand, a candlestick chart can also help you decide if it’s time to sell or stay out of the market temporarily by identifying a price failure. For instance, if a higher high price trend suddenly closes low on the market, this could be a sign of weakness, which signals that the market might not do well on the next opening.
If a price failure happens, it’s best to sit it out rather than take risks, especially if you’re starting as a trader.
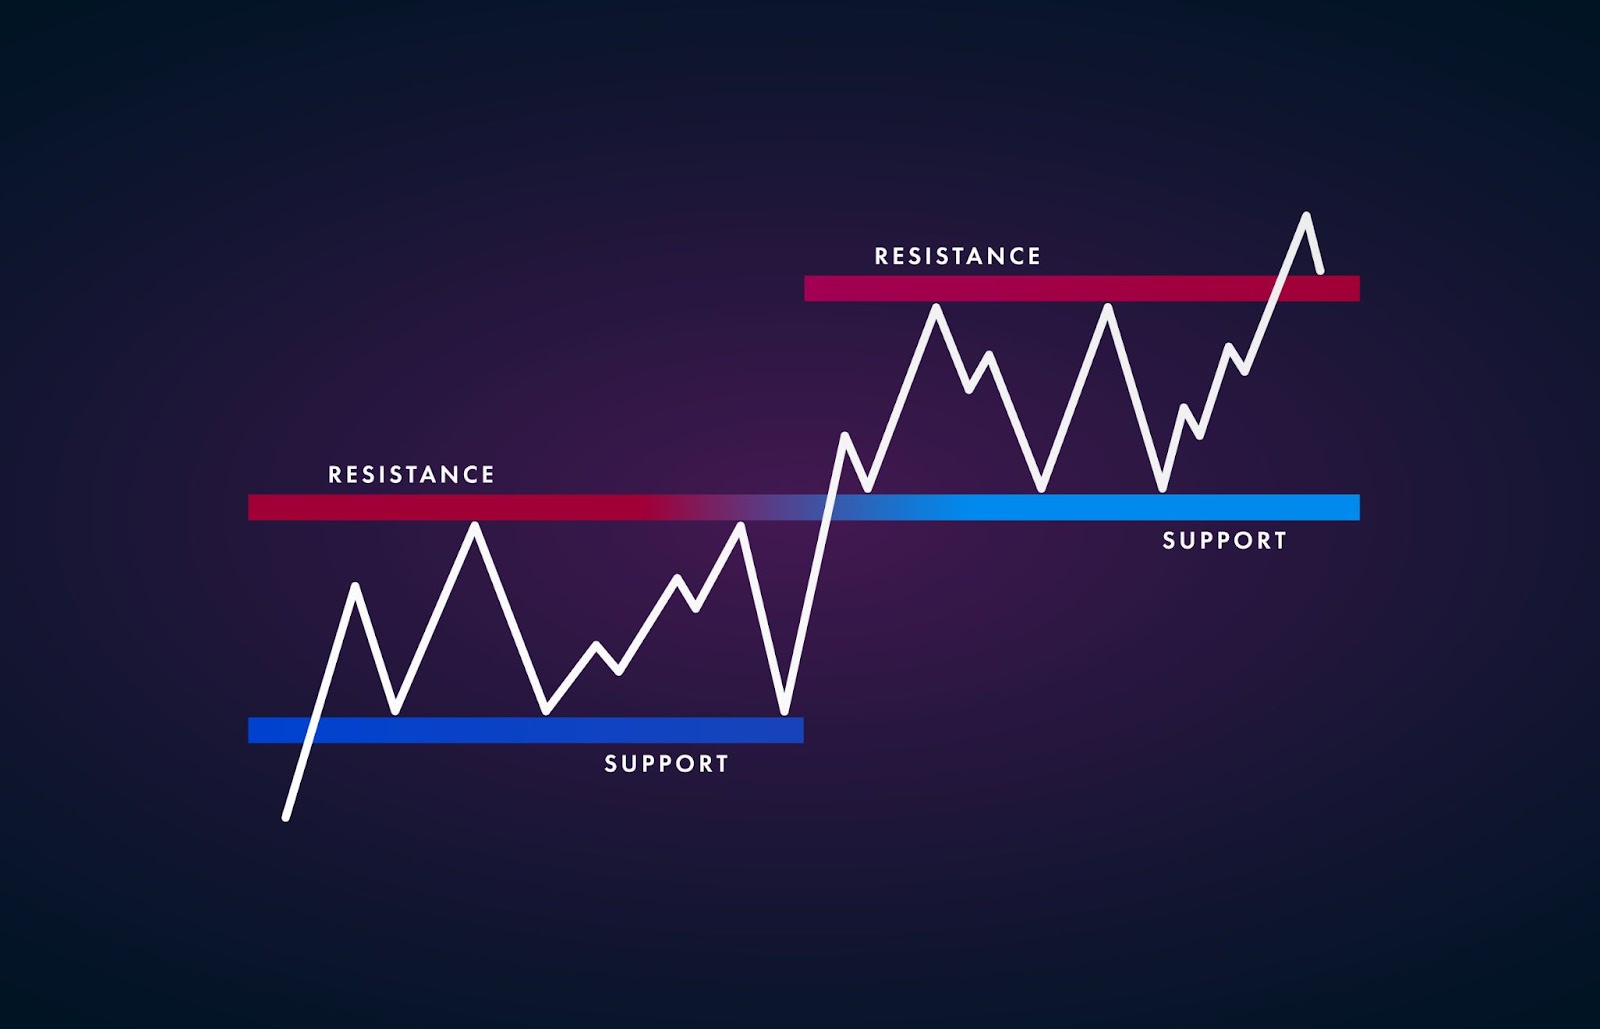
Support and resistance are very familiar terms in market structure because they help define price movement. Support is a price level that can stop a downtrend because of an increase in buying interest or a concentration of demand.
On the other hand, resistance is a price level that prevents an uptrend because there’s an increase in sellers.
With trading, trends can be one of your strongest allies. For this reason, you must understand the market structure to make the right decisions regarding how you play your cards within a trading day.
Although you can’t avoid losses at some point, having a good understanding of market structure will give you better chances of earning more significant profits and protecting your portfolio from huge losses.
So, if you want to learn more about market structure and other strategies, trade with a multi-assets broker like VT Markets, where you can get the best insights and support about trading.